S&P 500 — US Large Cap Index
 FTSE 100 — UK Blue Chips
 Euro Stoxx 50 — Eurozone Leaders
 DAX 40 — German Equities
 CAC 40 — French Market Index
 Nikkei 225 — Japan Benchmark
 Hang Seng — Hong Kong Index
 Shanghai Composite — China Mainland
 ASX 200 — Australian Market
 TSX Composite — Canada Index
 Nifty 50 — India Large Cap
 STI Index — Singapore Market
 KOSPI — South Korea Index
 Bovespa — Brazil Equities
 JSE Top 40 — South Africa Index
 IPC Index — Mexico Market
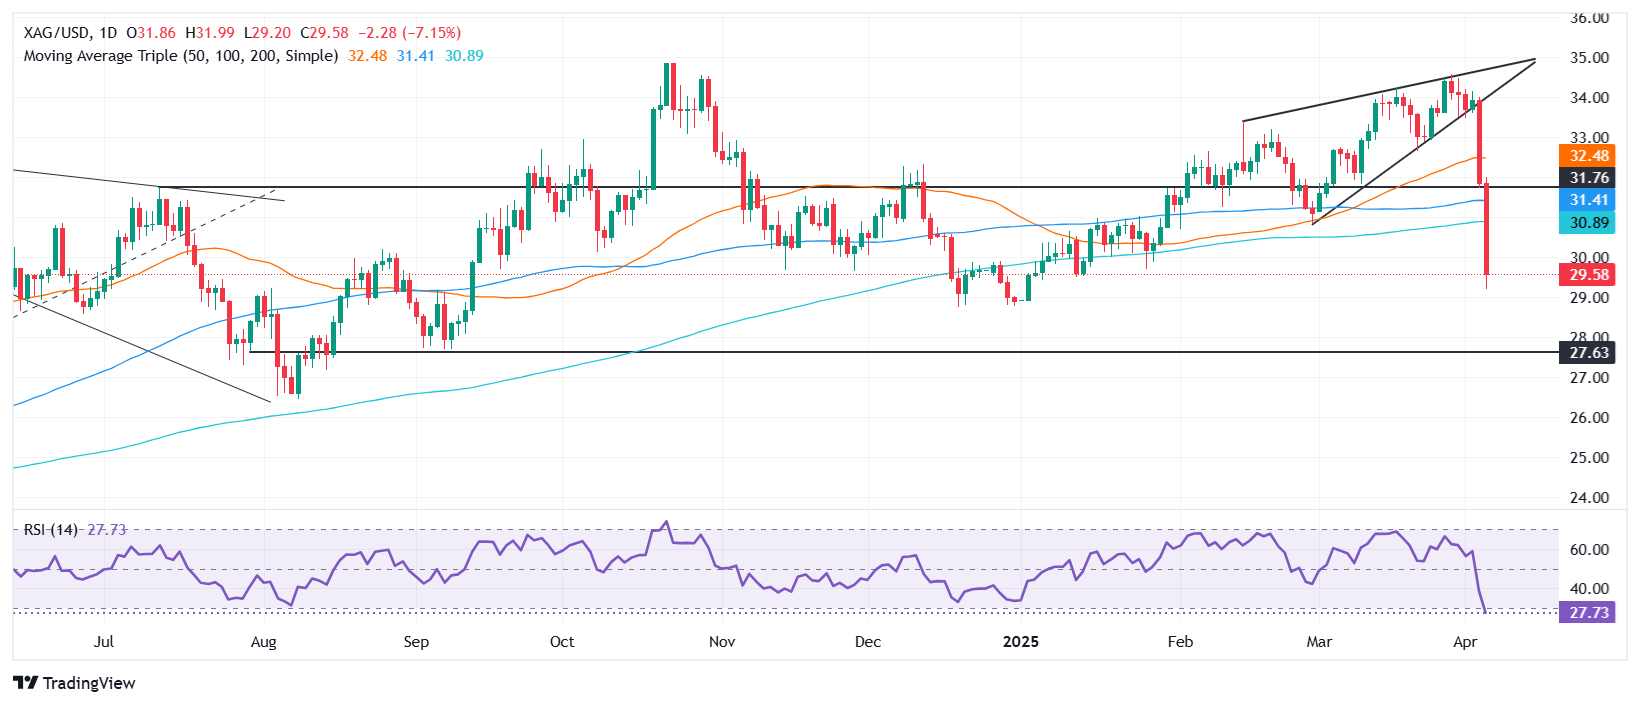
- Silver breaks below 100- and 200-day SMAs, signals strong bearish momentum amid escalating US-China tariff battle.
- RSI enters oversold territory, but selling pressure may continue toward $28.74 and $27.71 if $29 fails to hold.
- A recovery above $30 could see buyers retest $30.86 SMA and key resistance near $31.00.
Silver price plummeted on Friday as financial market turmoil continued for the third straight day, following US President Donald Trump’s decision to impose reciprocal tariffs. Consequently, China retaliated, sparking fears of a global economic slowdown. The XAG/USD trades at $29.55, sinking more than 7%.
XAG/USD Price Forecast: Technical outlook
On its way lower, Silver fell below the 100- and 200-day Simple Moving Averages (SMAs) on Friday, indicating a strong sell-off, once the grey metal cleared $31.39 and $30.86, respectively. Although the Relative Strength Index (RSI) turned bearish and oversold, due to the aggressiveness of the move, XAG/USD could continue to edge lower.
If XAG/USD falls below $29.00, this could expose the December 19 swing low of $28.74. Once surpassed, the next support would be the September 3 low of $27.71. Conversely, if XAG/USD climbs past $30.00, buyers could be poised to challenge the 200-day SMA at $30.86, followed by the $31 mark.
XAG/USD Price Chart – Daily