S&P 500 — US Large Cap Index
 FTSE 100 — UK Blue Chips
 Euro Stoxx 50 — Eurozone Leaders
 DAX 40 — German Equities
 CAC 40 — French Market Index
 Nikkei 225 — Japan Benchmark
 Hang Seng — Hong Kong Index
 Shanghai Composite — China Mainland
 ASX 200 — Australian Market
 TSX Composite — Canada Index
 Nifty 50 — India Large Cap
 STI Index — Singapore Market
 KOSPI — South Korea Index
 Bovespa — Brazil Equities
 JSE Top 40 — South Africa Index
 IPC Index — Mexico Market
- NZD/USD fell sharply toward the 0.5600 zone on Friday, tracking heavy daily losses ahead of the Asian session.
- Momentum indicators align bearishly, with MACD and Bull Bear Power showing clear selling pressure.
- Major moving averages and resistance near 0.5700 cap upside attempts for now.
The NZD/USD pair collapsed on Friday, diving toward the 0.5600 area as bearish momentum dominated the session. The pair traded deep in the red, shedding over 3% on the day and remaining mid-range between recent extremes at 0.5551 and 0.5798. Sellers stayed firmly in control through the day, with technical indicators confirming the downturn. The action unfolds during Friday’s session ahead of the Asian opening.
Daily chart
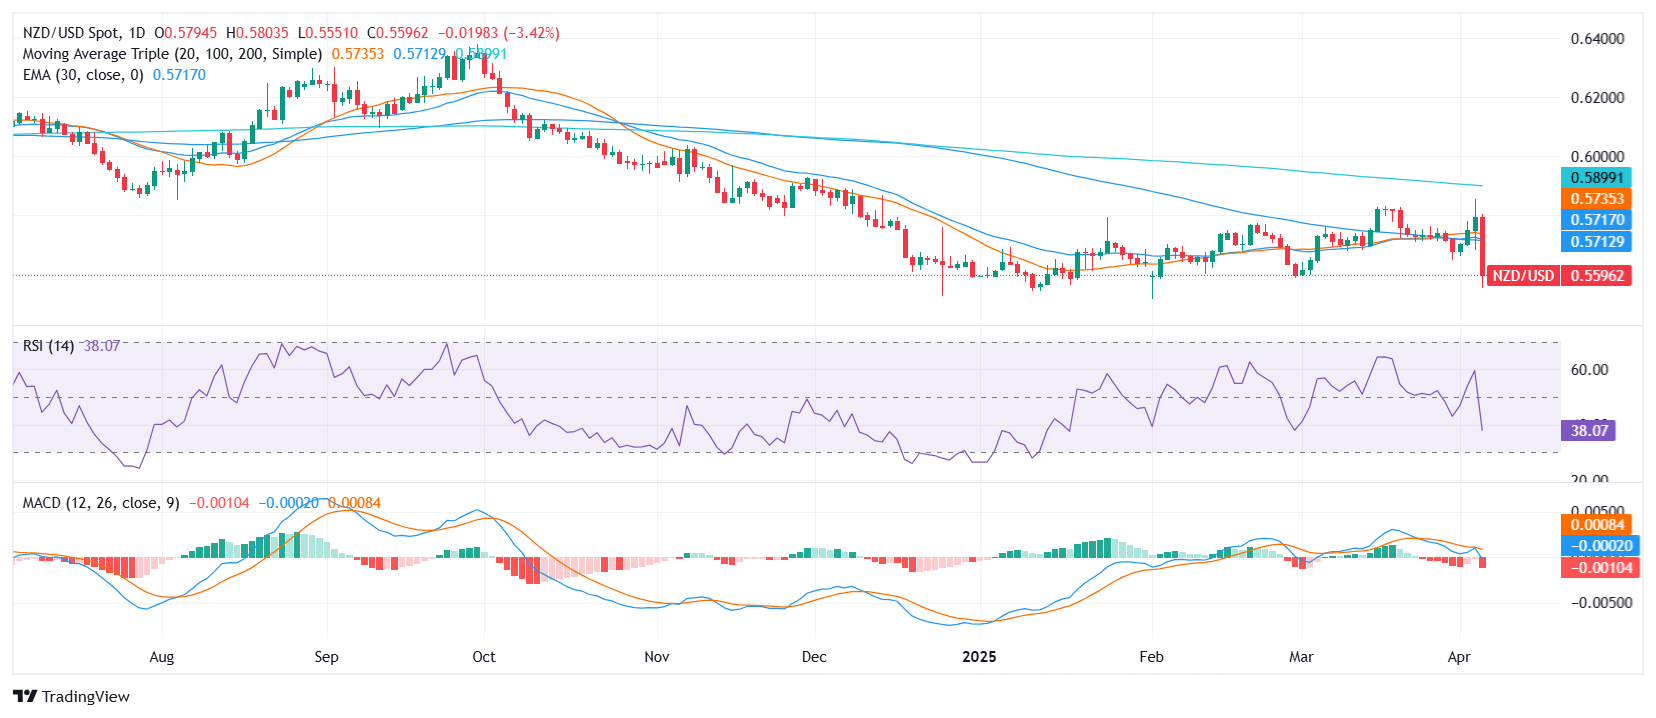
Technicals suggest a clear downside bias. The Moving Average Convergence Divergence (MACD) and Bull Bear Power indicator both print sell signals, amplifying bearish sentiment. While the Relative Strength Index (RSI) at 37.21 flirts with oversold territory.
Moving averages reinforce the bearish tone across the board. The 10-day Exponential Moving Average (EMA) at 0.57105 and 10-day Simple Moving Average (SMA) at 0.57148 are both aligned lower. Longer-term indicators, including the 20-day SMA at 0.57342, the 100-day at 0.57177, and the 200-day at 0.59039, confirm an extended period of selling pressure.