S&P 500 — US Large Cap Index
 FTSE 100 — UK Blue Chips
 Euro Stoxx 50 — Eurozone Leaders
 DAX 40 — German Equities
 CAC 40 — French Market Index
 Nikkei 225 — Japan Benchmark
 Hang Seng — Hong Kong Index
 Shanghai Composite — China Mainland
 ASX 200 — Australian Market
 TSX Composite — Canada Index
 Nifty 50 — India Large Cap
 STI Index — Singapore Market
 KOSPI — South Korea Index
 Bovespa — Brazil Equities
 JSE Top 40 — South Africa Index
 IPC Index — Mexico Market
The Nasdaq 100 Index (US100) is operating in an environment rife with conflicting signals, where impressive results from individual companies clash with mounting geopolitical risks and structural changes in the technology sector. The standoff between the U.S. and Iran, now in its ninth week, is driving oil prices up by more than 10% per week, which translates into rising inflationary pressure and complicates the Fed’s monetary policy path.
At the same time, the tech sector is experiencing an internal split — Intel surged 20% on excellent quarterly results, driving Nasdaq contracts higher, while software companies were brutally sold off following reports from IBM (-9.5%) and ServiceNow (-17.5%), as investors fear that artificial intelligence may cannibalize traditional software business models. Meta announced the layoff of 8,000 employees as part of a shift of resources toward AI, Microsoft offered voluntary severance packages for the first time in its history, and OpenAI unveiled GPT-5.5—all of which reinforces the impression that the tech industry is undergoing a profound transformation.
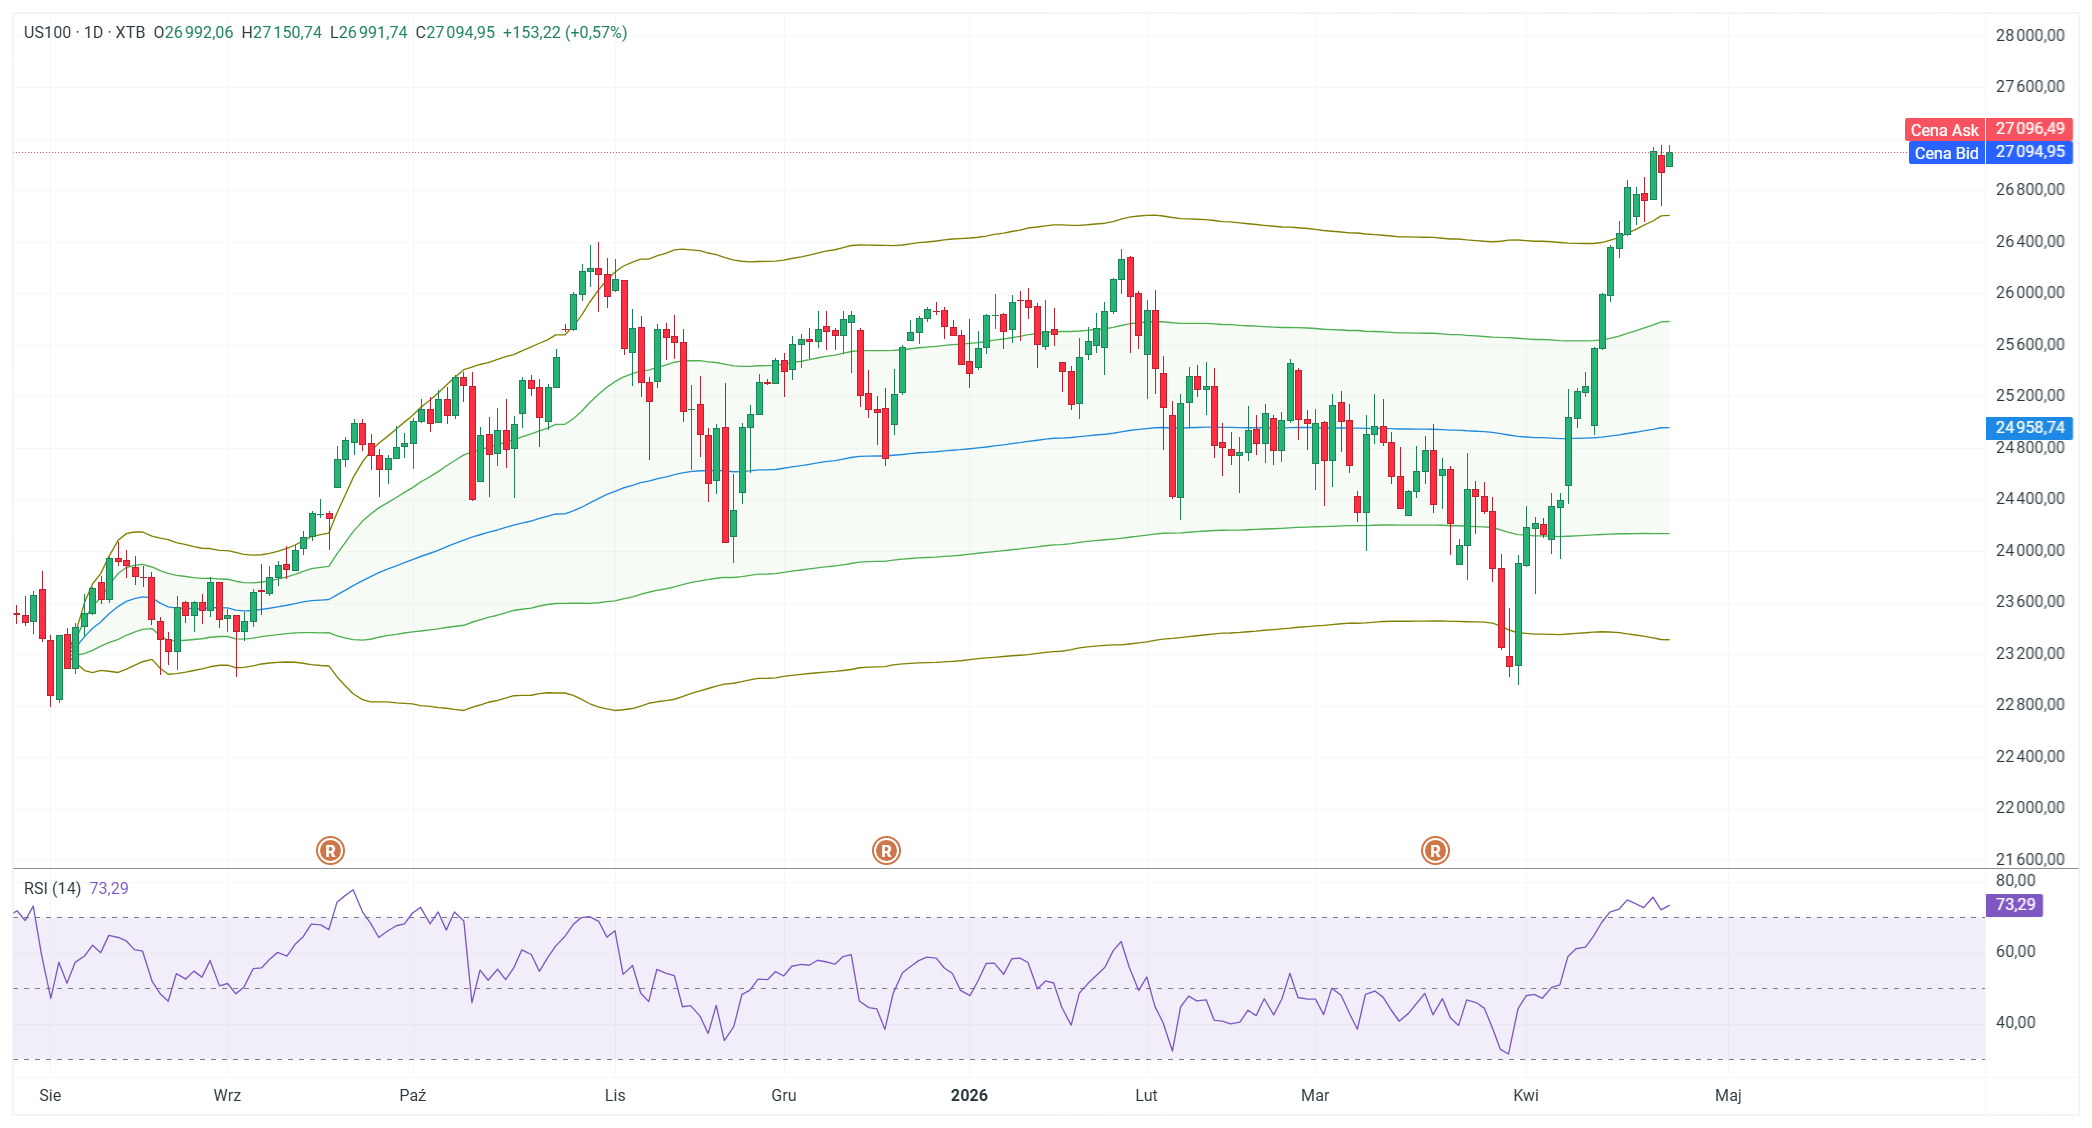
The stock market remains in “narrow leadership” mode, with gains driven almost exclusively by semiconductors—the iShares Semiconductor ETF has recorded its 17th consecutive session of gains, while the software ETF is already down 16% year-to-date. On the US100 daily chart, we see a clear uptrend that has been in place since the low around 24,959 points at the turn of the year and has driven the index to its current levels around 27,095 points.
The price is moving within an orderly uptrend channel, systematically setting higher highs and higher lows, which confirms the strength of the bulls. However, it is worth noting the RSI(14) indicator, which has reached a value of 73.29—thereby exceeding the overbought zone at 70, which historically signals an increased risk of a correction or at least consolidation. Recent candles indicate some hesitation around current highs, and Thursday’s session—during which the index set a new intraday high only to ultimately close in the red—may be an early sign that upward momentum is waning.