S&P 500 — US Large Cap Index
 FTSE 100 — UK Blue Chips
 Euro Stoxx 50 — Eurozone Leaders
 DAX 40 — German Equities
 CAC 40 — French Market Index
 Nikkei 225 — Japan Benchmark
 Hang Seng — Hong Kong Index
 Shanghai Composite — China Mainland
 ASX 200 — Australian Market
 TSX Composite — Canada Index
 Nifty 50 — India Large Cap
 STI Index — Singapore Market
 KOSPI — South Korea Index
 Bovespa — Brazil Equities
 JSE Top 40 — South Africa Index
 IPC Index — Mexico Market
Facts:
- The index registered 3 declining sessions after surpassing the FIBO 23.6 level of the last upward wave.
- The index tested the local peak (FIBO 0) twice, after which it experienced a downward correction.
- The gap between the EMA50 and EMA100 averages and the MACD/Signal has been decreasing over the past weeks.
Trade: Short position (SHORT) on DE40 at market price
- Target: 23350
- Stop: 24880
DE40 (D1)
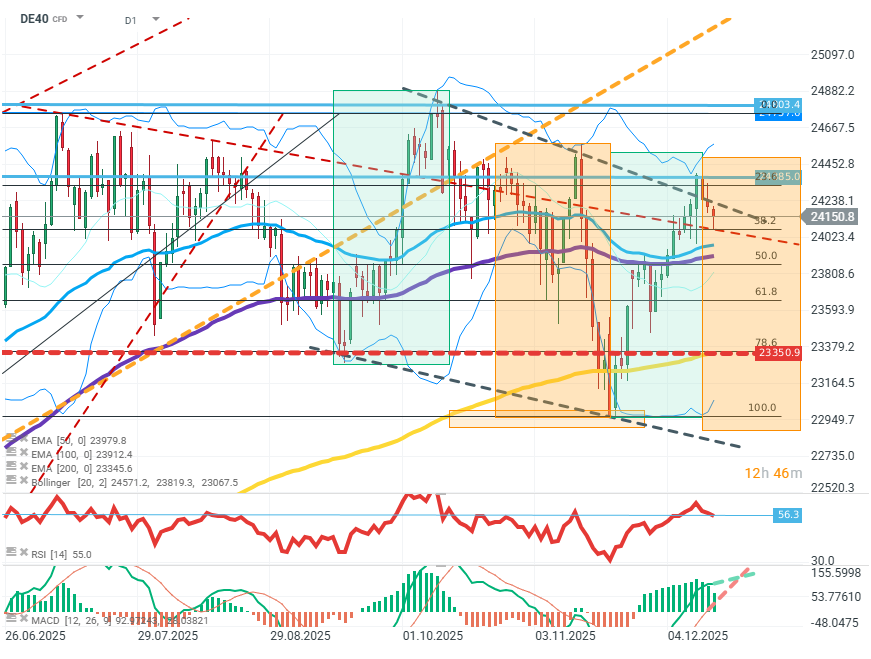
Source: xStation5
Opinion: On the index chart, a prolonged and increasing weakness of buyers can be observed. After testing and retreating from the peak twice, the price fell and reached lower peaks and greater declines twice. The gap between local peaks and FIBO 0 is widening, while the spreads between the EMA averages and MACD are decreasing, clearly signaling a decline in growth momentum. The upper Bollinger band, from which the price retreated, will also favor selling. Importantly, DE40 contracts will be subject to the phenomenon of rolling on 18.12.2025. Based on the term structure of contracts, the price may register an upward movement to around 24400, which does not negate the findings of technical analysis.
Methodology and assumptions:
- The recommendation was based on technical analysis of the chart, particularly the RSI indicator, Fibonacci levels, MACD and Bollinger Bands.
- The target level was determined based on the possible range of correction, considering the extent of recent downward corrections and based on the FIBO 78.6 level, where the resistance zone may be strongest.
- The defensive stop loss order was based on local peaks, where retesting them could negate the correction scenario.