- GBP/USD attracts some buyers to near 1.3290 in Monday’s early European session.
- The positive view of the pair prevails above the key 100-day EMA with the bullish RSI indicator.
- The first upside barrier is seen at 1.3445; the initial support level is located at 1.3234.
The GBP/USD pair gains traction to around 1.3290 during the early European session on Monday. The US Dollar (USD) softens against the Pound Sterling (GBP) amid heightened economic uncertainty in the wake of US President Donald Trump’s erratic trade policies.
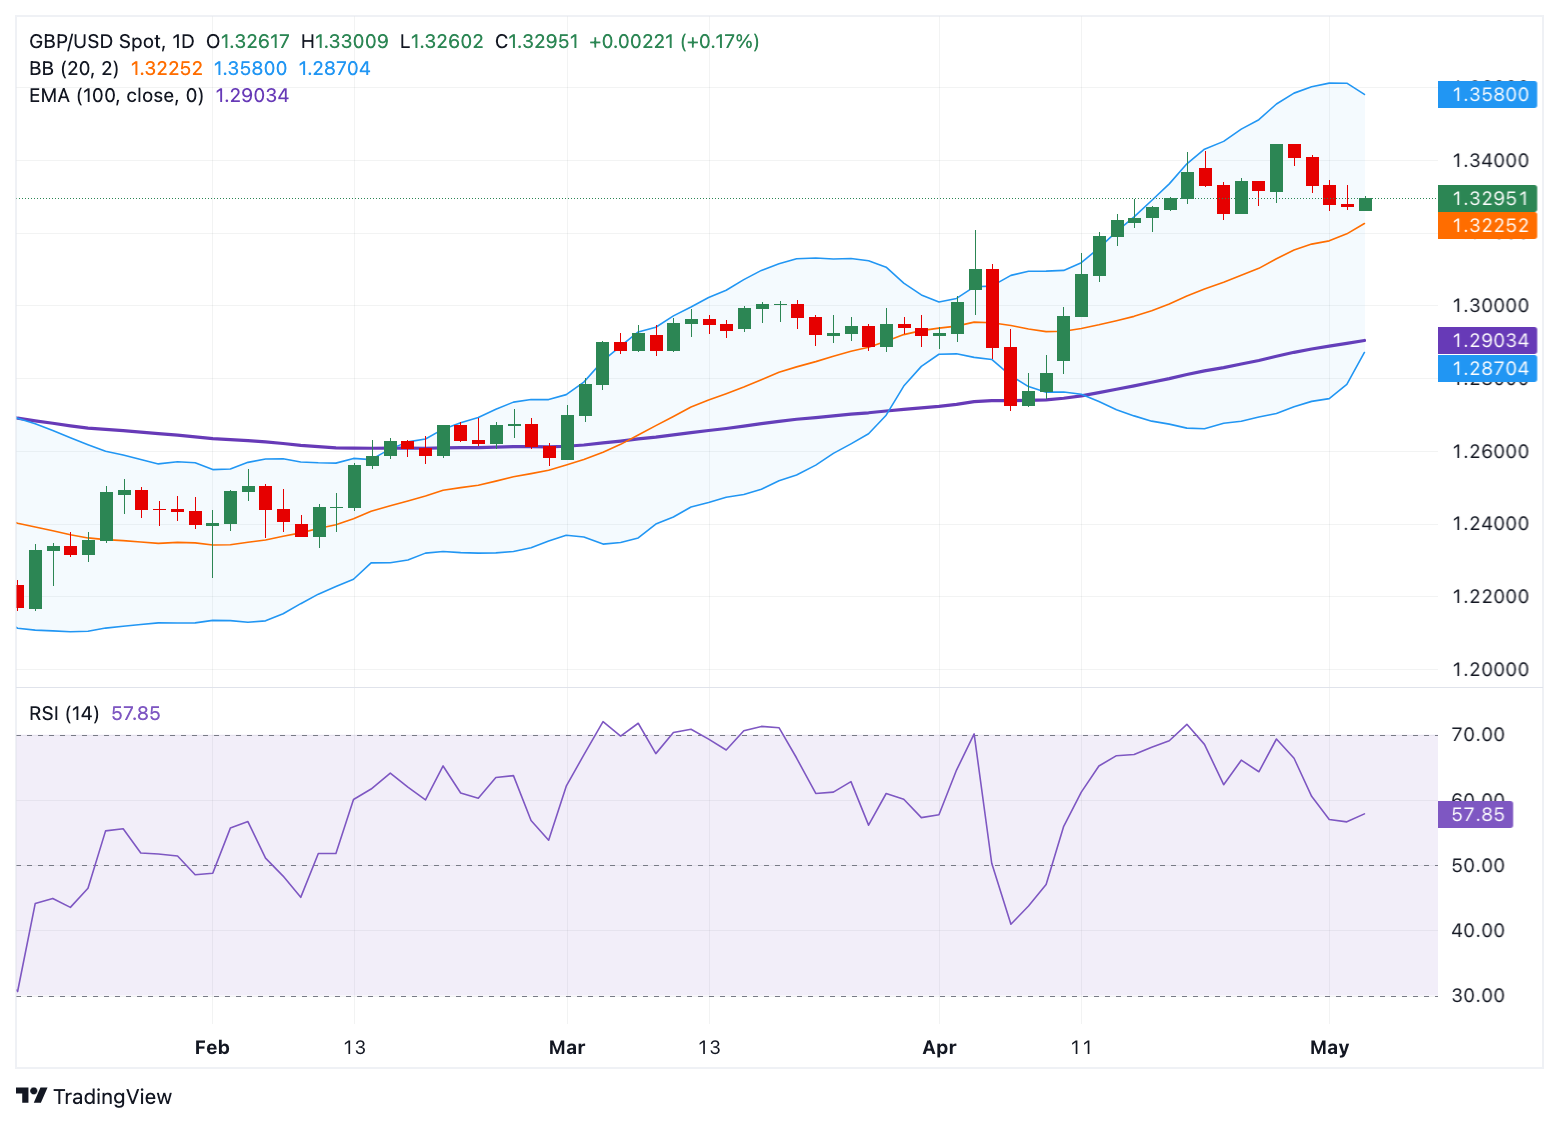
According to the daily chart, the bullish outlook of GBP/USD remains intact, characterized by the price holding above the key 100-day Exponential Moving Average (EMA). The upward momentum is supported by the 14-day Relative Strength Index (RSI), which stands above the midline near 55.60, suggesting the path of least resistance is to the upside.
The immediate resistance level emerges at 1.3445, the high of April 28. Extended gains could see a rally to 1.3580, the upper boundary of the Bollinger Band. Further north, the next hurdle is located at 1.3642, the high of February 18, 2022.
On the flip side, the low of April 23 at 1.3234 acts as an initial support level for a major pair. The key contention level to watch is the 1.3000 psychological level. The additional downside filter is seen at 1.2905, the 100-day EMA, followed by 1.2870, the lower limit of the Bollinger Band.
GBP/USD daily chart