S&P 500 — US Large Cap Index
 FTSE 100 — UK Blue Chips
 Euro Stoxx 50 — Eurozone Leaders
 DAX 40 — German Equities
 CAC 40 — French Market Index
 Nikkei 225 — Japan Benchmark
 Hang Seng — Hong Kong Index
 Shanghai Composite — China Mainland
 ASX 200 — Australian Market
 TSX Composite — Canada Index
 Nifty 50 — India Large Cap
 STI Index — Singapore Market
 KOSPI — South Korea Index
 Bovespa — Brazil Equities
 JSE Top 40 — South Africa Index
 IPC Index — Mexico Market
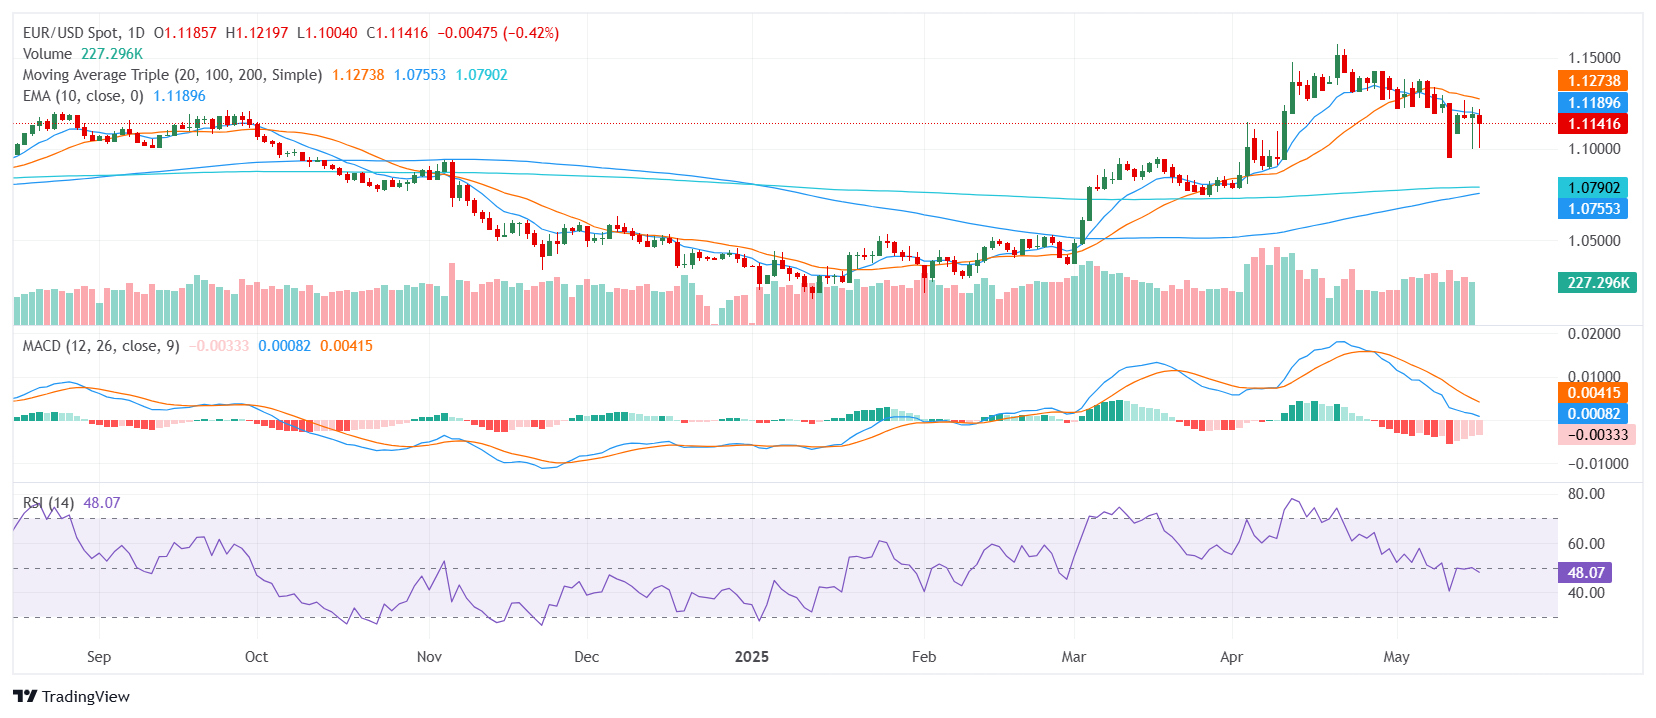
- EUR/USD trades near the 1.1100 zone with minor losses on Friday.
- The pair maintains a bearish outlook, supported by mixed technical signals.
- Key support is clustered below 1.1150, with resistance near 1.1200.
The EUR/USD pair is under modest selling pressure on Friday, moving near the lower end of its daily range around the 1.1100 zone. This positioning reflects a bearish tone, reinforced by a cluster of short-term technical indicators that favor downside momentum, despite some mixed signals from longer-term trends. As the European session wraps up, traders appear cautious, aligning with the broader risk-off sentiment in the market.
EUR/USD currently maintains a bearish bias, as highlighted by the alignment of its short-term moving averages. The 10-period Exponential Moving Average (EMA) and the 10-period Simple Moving Average (SMA) both point lower, signaling near-term selling pressure. The 20-day Simple Moving Average (SMA) also supports this bearish view, adding weight to the downside outlook. In contrast, the longer-term 100-day and 200-day SMAs indicate a more supportive backdrop, suggesting that the broader trend remains mixed.
Momentum indicators present a similarly cautious picture. The Relative Strength Index (RSI) hovers around the 40 area, indicating neutral momentum, while the Moving Average Convergence Divergence (MACD) clearly favors selling, adding to the pair’s downside risk. The Average Directional Index (14) is in the 30s, further confirming the bearish tone, while the Ultimate Oscillator (7, 14, 28) remains in neutral territory, reflecting the current indecision among traders. The Awesome Oscillator also mirrors this neutrality, failing to provide a clear directional cue.
Looking ahead, immediate support is found around 1.1144, with additional levels near 1.1106 and 1.1094. On the upside, resistance is likely to emerge around 1.1193, followed closely by 1.1209 and 1.1222, potentially capping any recovery attempts as the pair struggles to break out of its current downtrend.
Daily Chart