S&P 500 — US Large Cap Index
 FTSE 100 — UK Blue Chips
 Euro Stoxx 50 — Eurozone Leaders
 DAX 40 — German Equities
 CAC 40 — French Market Index
 Nikkei 225 — Japan Benchmark
 Hang Seng — Hong Kong Index
 Shanghai Composite — China Mainland
 ASX 200 — Australian Market
 TSX Composite — Canada Index
 Nifty 50 — India Large Cap
 STI Index — Singapore Market
 KOSPI — South Korea Index
 Bovespa — Brazil Equities
 JSE Top 40 — South Africa Index
 IPC Index — Mexico Market
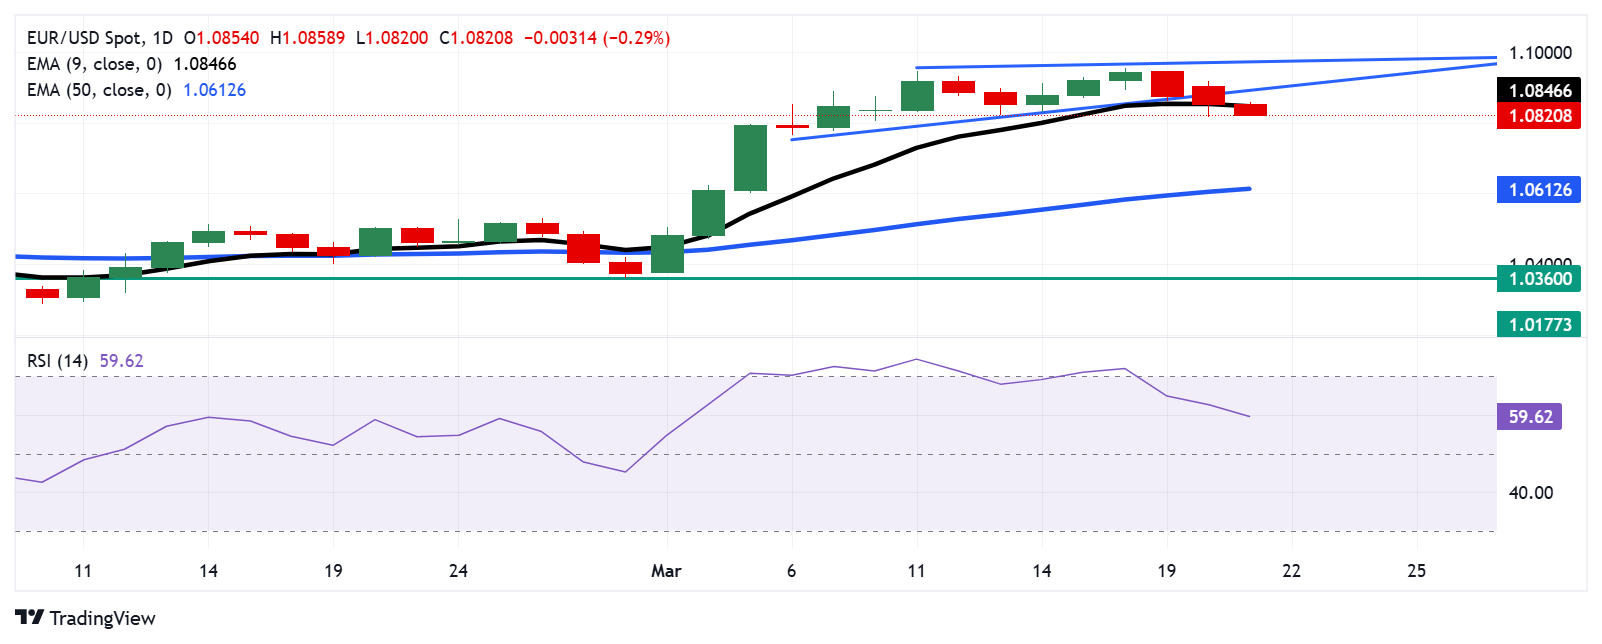
- The EUR/USD may test immediate support at the nine-day EMA of 1.0846 in an attempt to re-enter the ascending triangle.
- The 14-day RSI remains above 50, indicating that the bullish outlook is still intact.
- A break below the 50-day EMA at 1.0612 could weaken medium-term price momentum.
The EUR/USD continues its decline for the third consecutive session, hovering around 1.0830 during Friday’s Asian trading hours. The technical analysis of the daily chart suggests growing selling pressure and a possible trend reversal, as the pair has fallen below the ascending channel pattern.
Furthermore, the EUR/USD pair has dropped below the nine-day Exponential Moving Average (EMA), signaling weaker short-term price momentum. However, the 14-day Relative Strength Index (RSI), a key momentum indicator, remains above the 50 mark, suggesting that a bullish outlook is still intact. A continued decline would confirm the shift toward a bearish outlook.
The EUR/USD pair could test immediate support at the nine-day EMA of 1.0846 level. A breakout above this level could strengthen short-term price momentum, allowing the pair to re-enter the ascending triangle. This could revive the bullish bias and potentially push the pair toward the triangle’s upper boundary near 1.0980.
On the downside, the EUR/USD pair may target the 50-day EMA at the 1.0612 level. A break below this support could weaken medium-term price momentum, potentially extending the decline toward the six-week low of 1.0360, recorded on February 28.
EUR/USD: Daily Chart
Euro PRICE Today
The table below shows the percentage change of Euro (EUR) against listed major currencies today. Euro was the weakest against the US Dollar.
| USD | EUR | GBP | JPY | CAD | AUD | NZD | CHF | |
|---|---|---|---|---|---|---|---|---|
| USD | 0.31% | 0.32% | 0.54% | 0.11% | 0.29% | 0.13% | 0.24% | |
| EUR | -0.31% | 0.03% | 0.23% | -0.17% | -0.01% | -0.11% | -0.08% | |
| GBP | -0.32% | -0.03% | 0.21% | -0.19% | -0.03% | -0.13% | -0.10% | |
| JPY | -0.54% | -0.23% | -0.21% | -0.44% | -0.26% | -0.39% | -0.35% | |
| CAD | -0.11% | 0.17% | 0.19% | 0.44% | 0.16% | 0.06% | 0.10% | |
| AUD | -0.29% | 0.00% | 0.03% | 0.26% | -0.16% | -0.10% | -0.16% | |
| NZD | -0.13% | 0.11% | 0.13% | 0.39% | -0.06% | 0.10% | 0.04% | |
| CHF | -0.24% | 0.08% | 0.10% | 0.35% | -0.10% | 0.16% | -0.04% |
The heat map shows percentage changes of major currencies against each other. The base currency is picked from the left column, while the quote currency is picked from the top row. For example, if you pick the Euro from the left column and move along the horizontal line to the US Dollar, the percentage change displayed in the box will represent EUR (base)/USD (quote).