S&P 500 — US Large Cap Index
 FTSE 100 — UK Blue Chips
 Euro Stoxx 50 — Eurozone Leaders
 DAX 40 — German Equities
 CAC 40 — French Market Index
 Nikkei 225 — Japan Benchmark
 Hang Seng — Hong Kong Index
 Shanghai Composite — China Mainland
 ASX 200 — Australian Market
 TSX Composite — Canada Index
 Nifty 50 — India Large Cap
 STI Index — Singapore Market
 KOSPI — South Korea Index
 Bovespa — Brazil Equities
 JSE Top 40 — South Africa Index
 IPC Index — Mexico Market
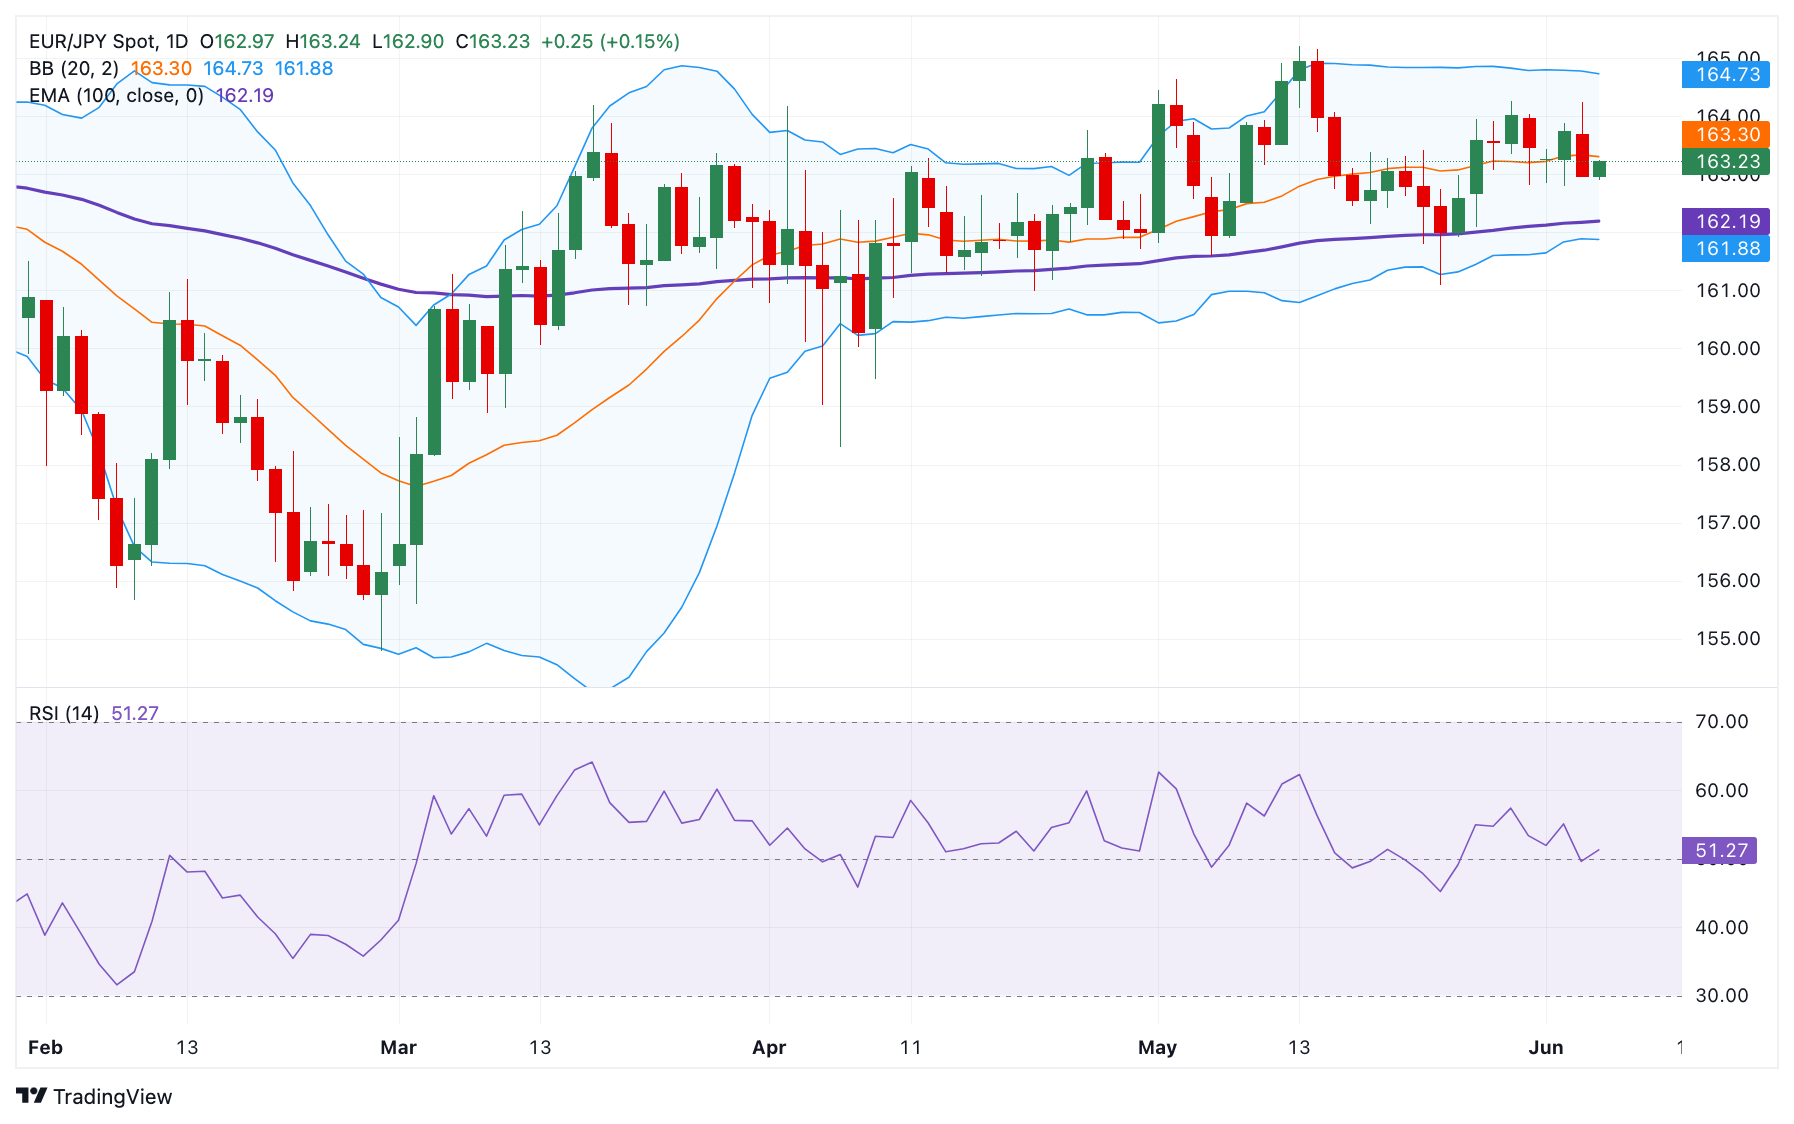
- EUR/JPY gains ground to near 163.15 in Thursday’s Asian session.
- The cross maintains constructive view above the 100-day EMA, but further consolidation cannot be ruled out with neutral RSI indicator.
- The immediate resistance level is seen at 164.24; the initial support level is located at 162.20.
The EUR/JPY cross edges higher to around 163.15 during the Asian trading hours on Thursday. The Japanese Yen (JPY) softens against the Euro (EUR) amid the expectation that the next interest rate hike by the Bank of Japan (BoJ) will not come soon.
According to a Reuters poll, most economists expect the BoJ to hold rates steady through September, with a small majority forecasting a hike by year-end. Nonetheless, persistent geopolitical risks and trade-related uncertainties might boost the safe-haven flows and help limit the JPY’s losses.
Technically, EUR/JPY keeps the bullish vibe on the daily chart, with the price holding above the key 100-day Exponential Moving Average (EMA). However, in the near term, further consolidation cannot be ruled out in the near term as the 14-day Relative Strength Index (RSI) hovers around the midline. This suggests neutral momentum in the near term.
The first upside target to watch for the cross is seen at 164.24, the high of June 4. Extended gains could see a rally to the upper boundary of the Bollinger Band of 164.75. Further north, the next hurdle is located at 165.21, the high of May 13.
On the other hand, the initial support level for EUR/JPY emerges at 162.20, the 100-day EMA. A breach of this level could expose 161.85, the lower limit of the Bollinger Band. The key contention level to watch is in the 161.10-161.00 zone, representing the low of May 23 and the psychological level.
EUR/JPY Daily Chart