This analysis from the Overbalance series aims to identify three financial instruments, analyzed primarily on the daily/four-hour (D1/H4) timeframe. The analysis relies solely on the Overbalance methodology, which helps determine points where a trend may continue or where a reversal might occur.
Today’s analysis covers three instruments, evaluated solely in terms of 1:1 correction structures.
GBPUSD
The GBPUSD price has broken its downward trend by rising above the 1.3360 level, which, according to the Overbalance methodology, paves the way for a larger upward correction or even a trend reversal. Currently, the 1.3360 level—the upper boundary of the negated 1:1 geometry—serves as key support. Conversely, for a return to the downtrend, the price would also need to fall below the 1.3315 level, where the lower boundary of the local 1:1 uptrend pattern is located.
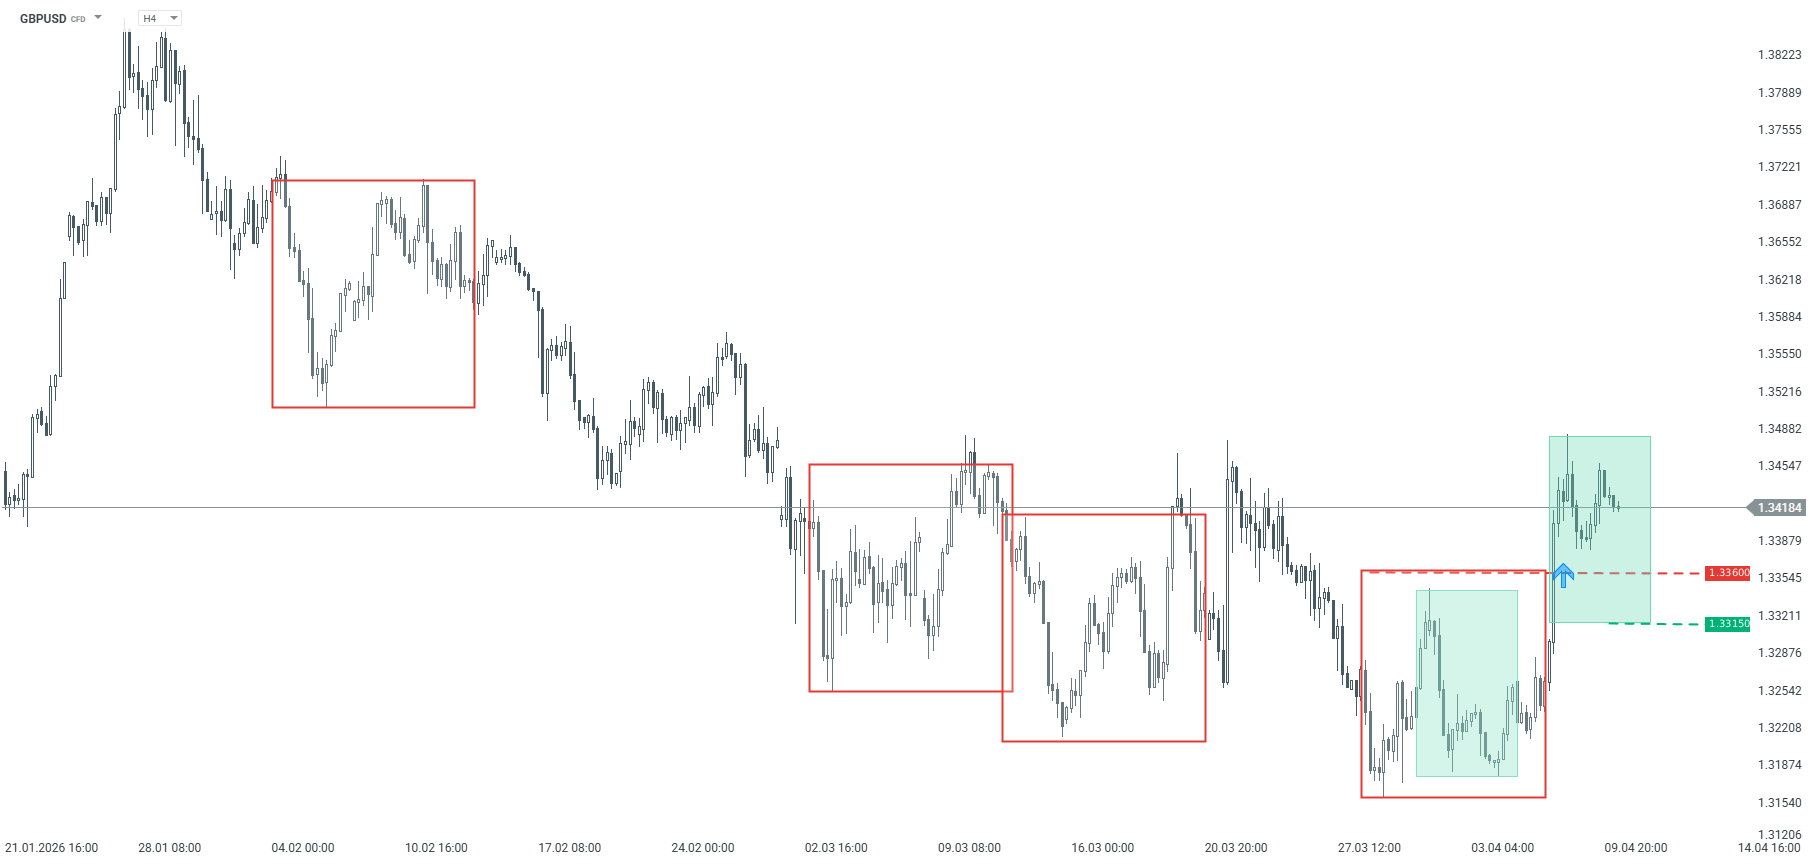
GBPUSD – H4 chart. Source: xStation
AUDNZD
The AUDNZD pair has been in an uptrend for quite some time. The latest correction was exactly the same size as the previous ones, marked by the green rectangle. We are currently observing a local corrective move. If the correction continues, key support based on the Overbalance methodology is at the 0.6992 level, where the lower boundary of the 1:1 pattern is located. As long as the price remains above this level, the uptrend remains in effect.
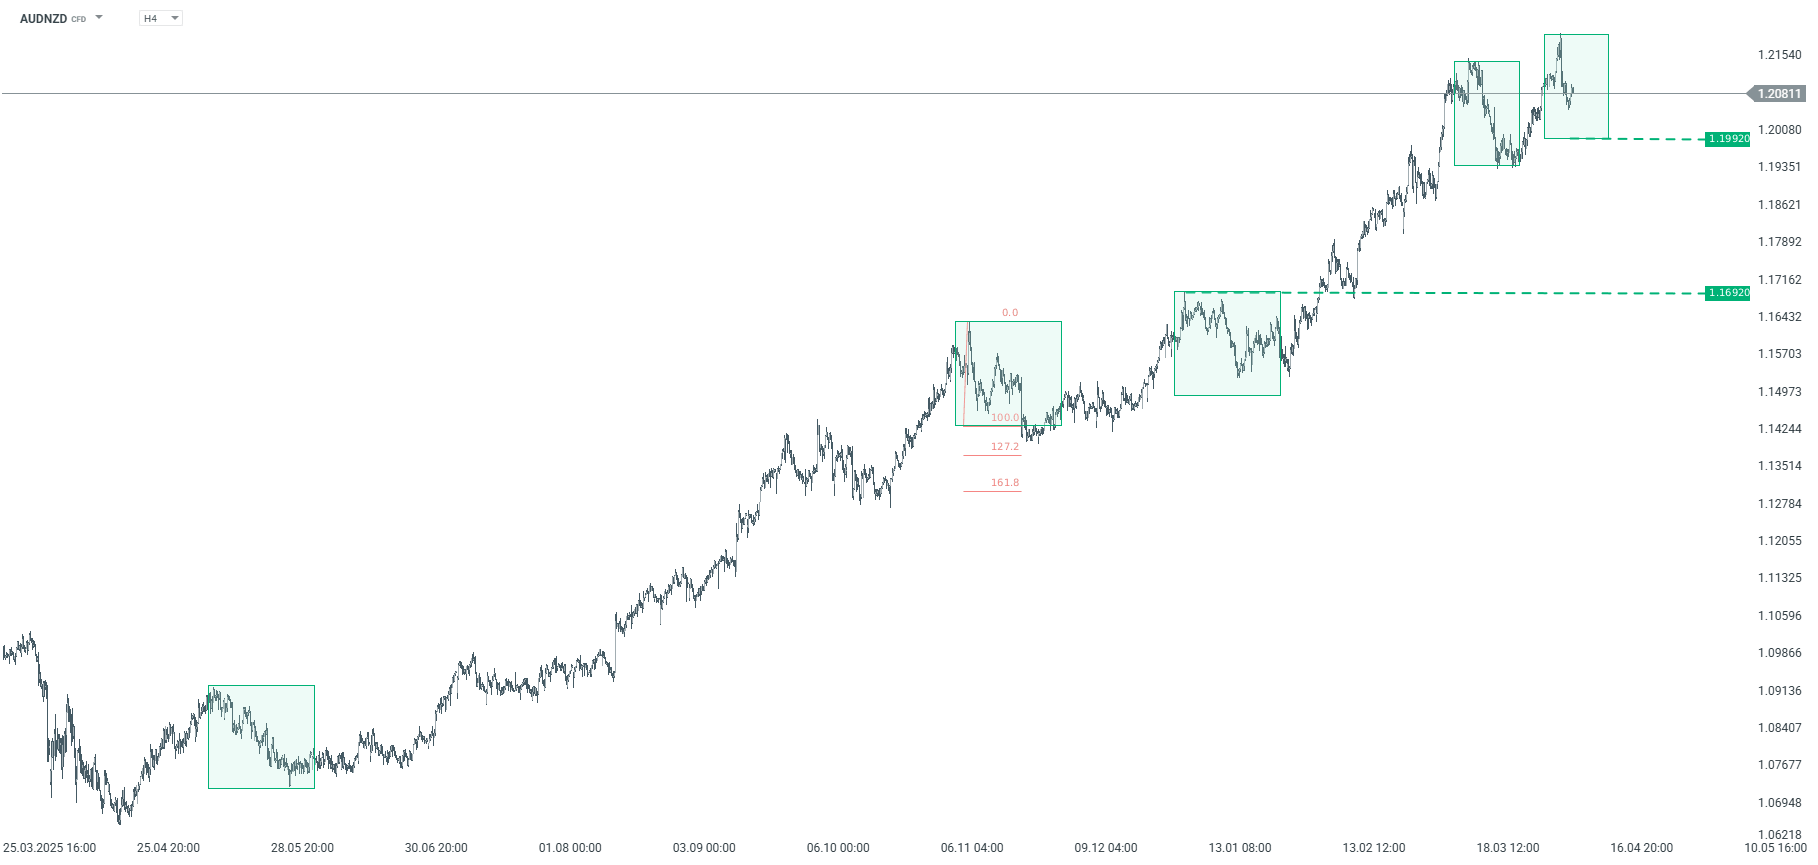
AUDNZD – H4 timeframe. Source: xStation
USDCHF
USDCHF prices have been trending downward for quite some time, but since late January we have seen a dynamic upward correction. Currently, the price has rebounded from a key resistance level at 0.8042, where the upper boundary of the largest 1:1 pattern is located, which, according to the Overbalance methodology, may signal a return to the downtrend. For this scenario to be confirmed, the price should sustainably fall below the 0.7902 level, where the lower boundary of the smaller pattern is located. In that case, a acceleration of the decline toward recent lows would be possible. Conversely, a break above the 0.8042 level would open the way for further gains.
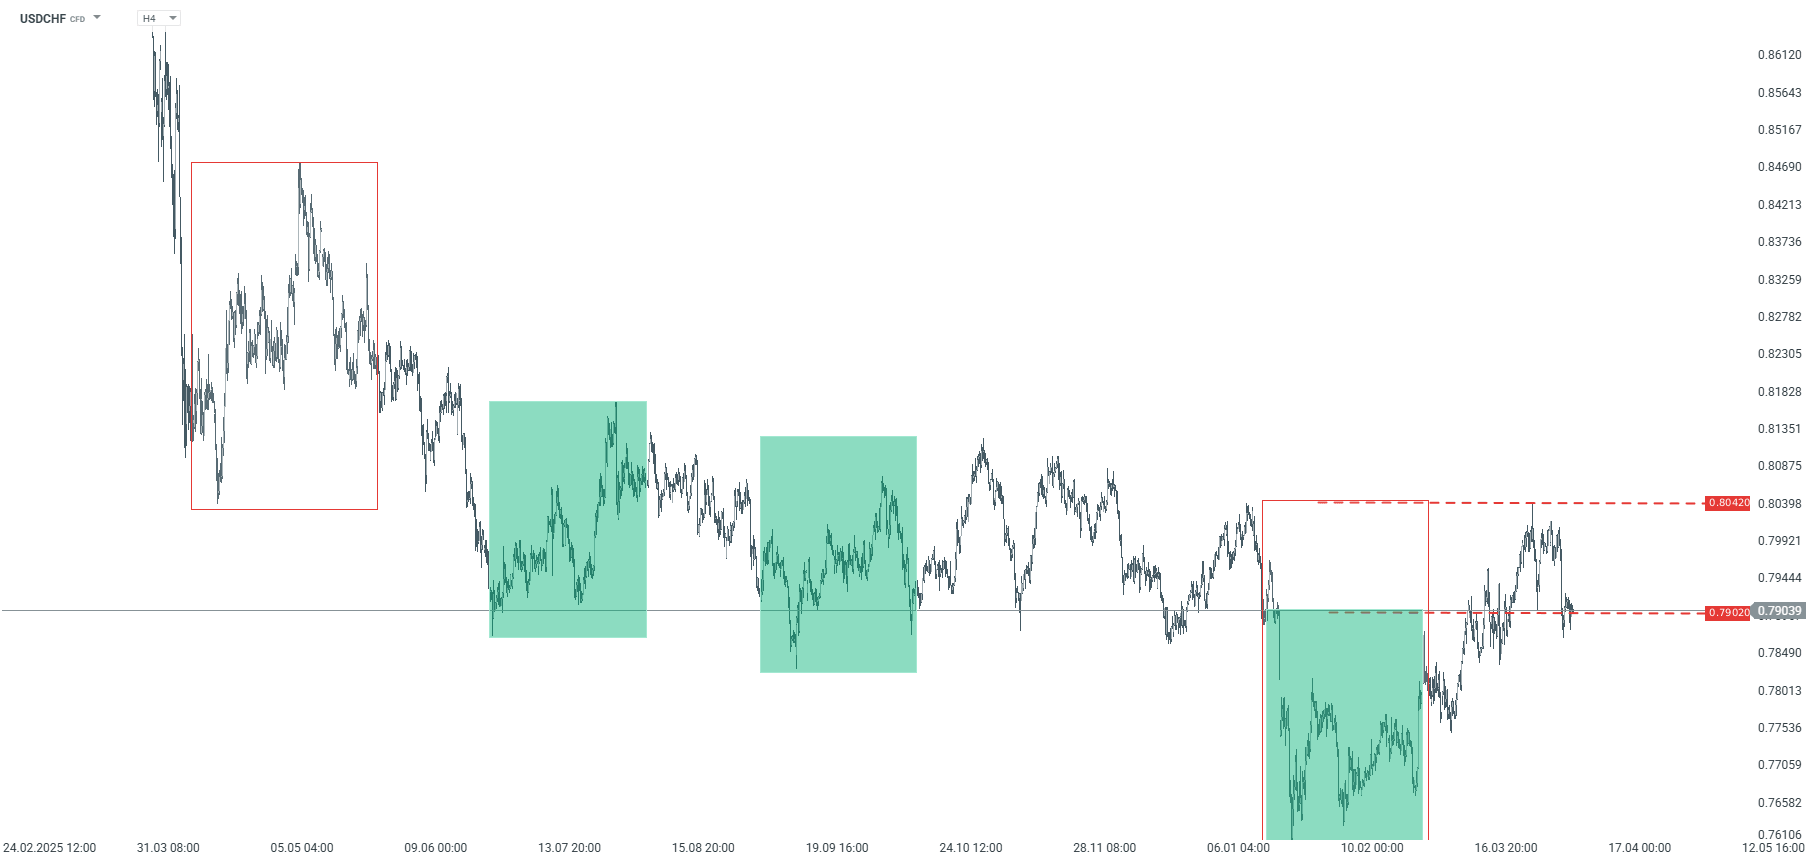
USDCHF – H4 timeframe. Source: xStation
The material on this page does not constitute financial advice and does not take into account your level of understanding, investment objectives, financial situation or any other specific needs. All information provided, including opinions, market research, mathematical results and technical analyzes published on the Website or transmitted To you by other means, it is provided for information purposes only and should in no way be construed as an offer or solicitation for a transaction in any financial instrument, nor should the information provided be construed as advice of a legal or financial nature on which any investment decisions you make should be based exclusively To your level of understanding, investment objectives, financial situation, or other specific needs, any decision to act on the information published on the Website or sent to you by other means is entirely at your own risk if you In doubt or unsure about your understanding of a particular product, instrument, service or transaction, you should seek professional or legal advice before trading. Investing in CFDs carries a high level of risk, as they are leveraged products and have small movements Often the market can result in much larger movements in the value of your investment, and this can work against you or in your favor. Please ensure you fully understand the risks involved, taking into account investments objectives and level of experience, before trading and, if necessary, seek independent advice.