S&P 500 — US Large Cap Index
 FTSE 100 — UK Blue Chips
 Euro Stoxx 50 — Eurozone Leaders
 DAX 40 — German Equities
 CAC 40 — French Market Index
 Nikkei 225 — Japan Benchmark
 Hang Seng — Hong Kong Index
 Shanghai Composite — China Mainland
 ASX 200 — Australian Market
 TSX Composite — Canada Index
 Nifty 50 — India Large Cap
 STI Index — Singapore Market
 KOSPI — South Korea Index
 Bovespa — Brazil Equities
 JSE Top 40 — South Africa Index
 IPC Index — Mexico Market
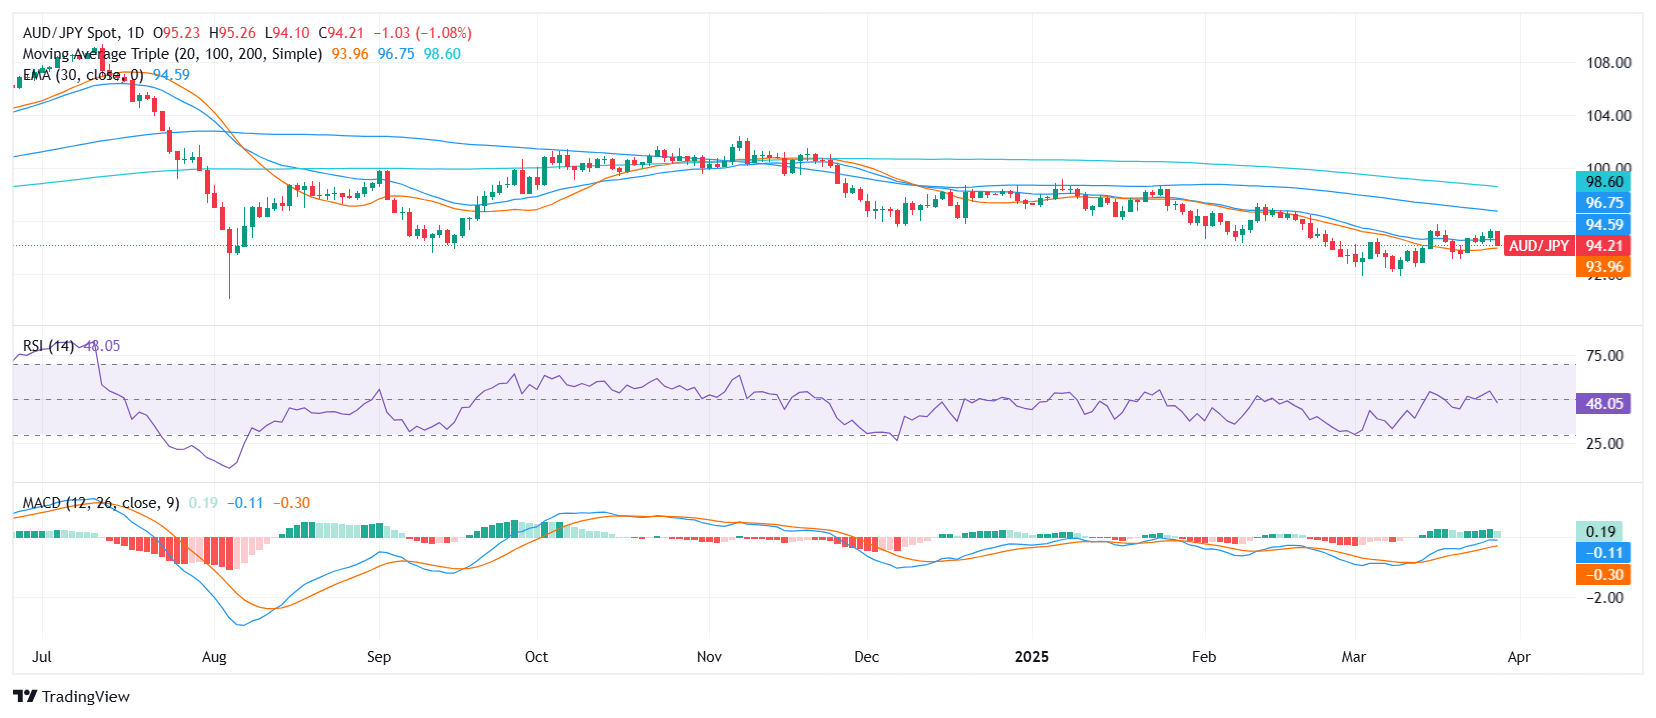
- AUD/JPY was seen near the 94.30 zone on Friday ahead of the Asian session, retreating toward the lower end of its daily range.
- Despite mixed signals from oscillators, moving averages tilt the broader technical bias to the downside.
- Support lies near 94.00 and 93.88, while resistance is seen just above 94.40; indicators remain conflicted with bearish lean.
The AUD/JPY pair extended its decline on Friday, hovering near the 94.30 zone after the European session and slipping closer to the lower end of its intraday range. The pair is down notably on the day, reflecting an increase in selling interest. While some momentum indicators remain neutral or even slightly constructive, broader technical signals continue to favor a bearish bias for the near term.
Looking at the indicators, the Relative Strength Index (RSI) fell below 50, yet neutral in tone, while the MACD posts a slight buy signal , hinting at possible short-term correction. However, the Bull Bear Power stands at 0.641, reinforcing the underlying selling pressure, and the Williams Percent Range remains neutral, failing to offer a clear reversal signal.
Moving averages present a split picture. The short-term 20-day Simple Moving Average (SMA) at 94.02 continues to signal a buy, offering dynamic support. However, the 10-day EMA (94.45) and SMA (94.58), along with the 100-day (96.85) and 200-day (98.70) SMAs, all lean bearish, suggesting that upside potential remains capped unless a structural shift occurs.
In terms of levels, immediate support emerges at 94.16, followed by 94.02 and 93.88. On the flip side, resistance is seen around 94.35, 94.42, and 94.45—just ahead of key short-term moving averages that could act as selling zones if bulls attempt to regain control.
AUD/JPY daily chart