XAG/USD experiences V-shape recovery from $30.50 after US ADP job data

- Silver price recovers strongly from $30.50 after US ADP Employment Change data misses estimates by a slight margin.
- Investors await Fed Powell’s speech for fresh guidance about the likely interest rate path.
- Traders expect the Fed to cut interest rates by 25 bps to 4.25%-4.50% on December 18.
Silver price (XAG/USD) recovers in a V-shape manner from the key support of $30.50 in Wednesday’s North American session and refreshes an intraday high near $31.20 after the release of the United States (US) ADP Employment Change data for November. The agency reported that the private sector hired fresh 146K workers, marginally missed estimates of 150K but was significantly lower from the former release of 184K, downwardly revised from 233K.
However, the private sector employment data has not weighed much on the US Dollar (USD). The US Dollar Index (DXY), which tracks the Greenback’s value against six major currencies, surrenders nominal gains but holds the key support of 106.50. 10-year US Treasury yields hold onto gains near 4.27%.
Historically, higher yields on interest-bearing assets increase the opportunity cost of holding an investment in non-yielding assets, such as Silver. But it doesn’t appear in this case, suggesting that geopolitical tensions continue to maintain safe-haven demand.
According to Reuters, the Hamas internal statement has reported that the group has information that Israel intends to carry out a hostage rescue operation similar to Israel’s June nuseirat operation in Gaza, a move that could derail the ceasefire between Iran and Israel. The appeal of the Silver price strengthens in a heightened geopolitical environment.
Going forward, investors will focus on Federal Reserve (Fed) Chair Jerome Powell’s speech at the New York Times DealBook Summit for fresh guidance on interest rates. The probability for the Fed to cut interest rates by 25 basis points (bps) to 4.25%-4.50% is 74%, while the rest favors leaving them unchanged at their current levels, according to the CME FedWatch tool.
Silver technical analysis
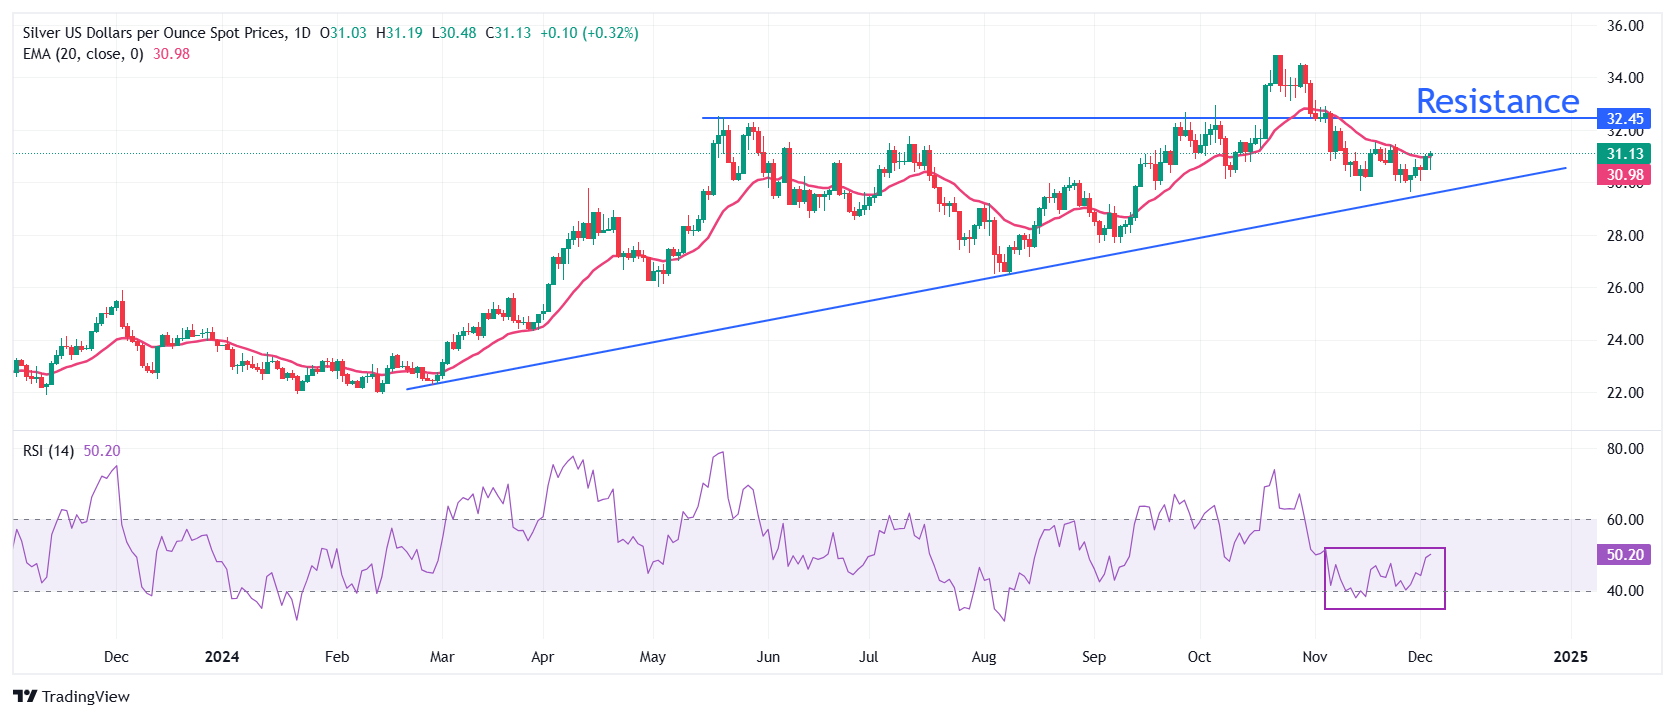
Silver price strives to extend recovery above the 20-day Exponential Moving Average (EMA), which trades around $31.30.
The 14-day Relative Strength Index (RSI) oscillates in the 40.00-60.00 range, suggesting a sideways trend.
Looking down, the upward-sloping trendline around $29.50, which is plotted from the February 29 low of $22.30 on a daily timeframe, would act as key support for the Silver price. On the upside, the horizontal support plotted from the May 21 high of $32.50 would be the resistance zone.
Silver daily chart


