- USD/MXN consolidates in a range above the monthly low touched earlier this week.
- The technical setup favors bearish traders and supports prospects for further losses.
- A sustained strength beyond the 100-day SMA is needed to negate the negative bias.
The USD/MXN pair struggles for a firm intraday direction on Wednesday and oscillates in a narrow trading band, around the 20.2790-20.2795 region through the Asian session. Spot prices, meanwhile, remain close to the lowest level since January 24 touched on Monday, and seem vulnerable to slide further amid the underlying bearish sentiment surrounding the US Dollar (USD).
Investors now seem convinced that a tariff-driven slowdown in the US economic activity and signs of a cooling US labor market might force the Federal Reserve (Fed) to cut interest rates several times this year. This, in turn, has been a key factor behind the recent USD downfall to its lowest level since mid-October set on Tuesday. The USD bears, however, seem reluctant to place fresh bets ahead of the release of the US consumer inflation figures, which, in turn, is seen acting as a tailwind for the USD/MXN pair.
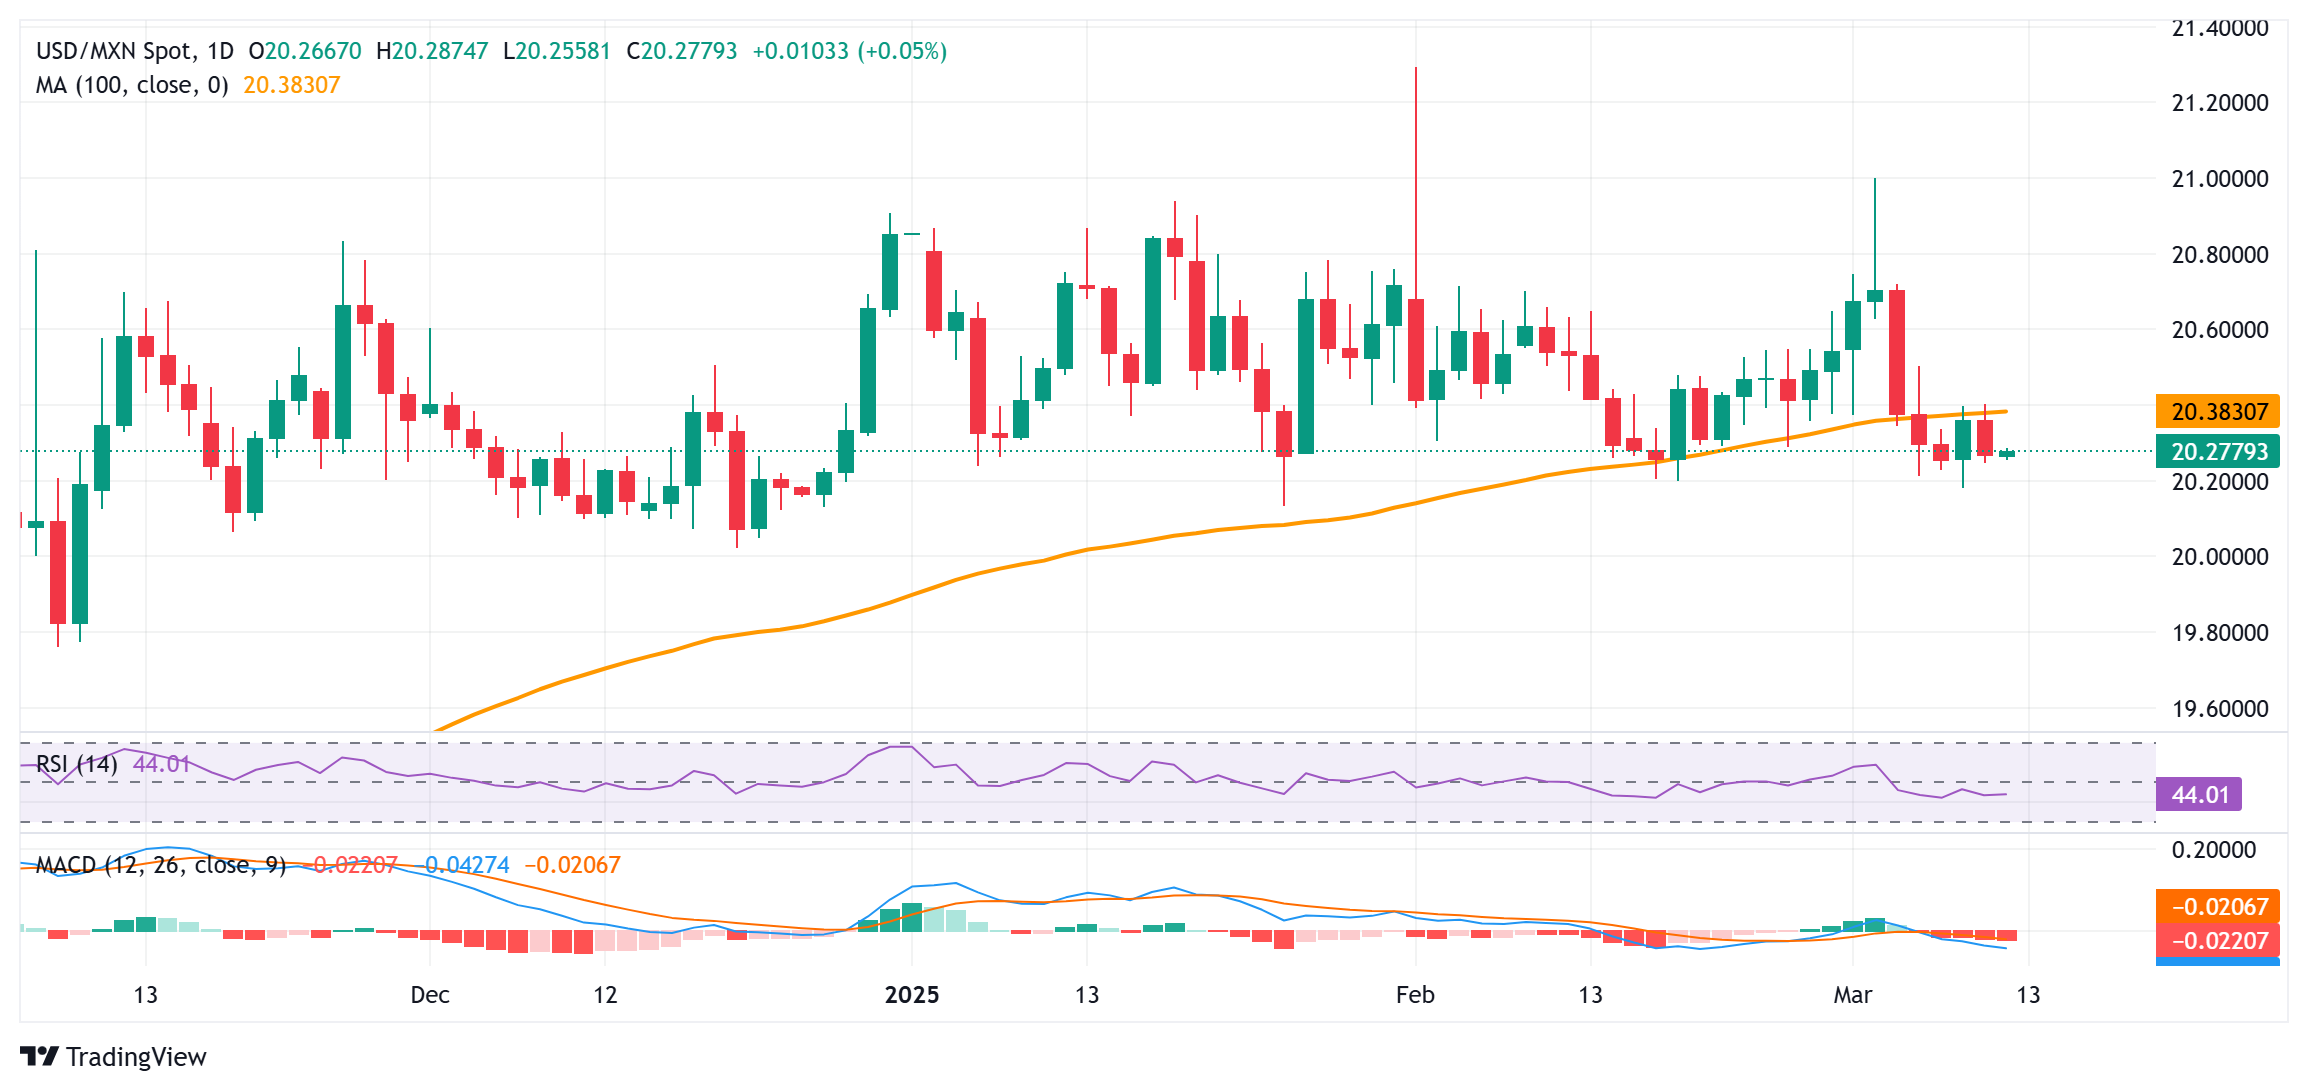
From a technical perspective, last week’s breakdown and acceptance below the 100-day Simple Moving Average (SMA) for the first time since May 2024 favors the USD/MXN bears. Moreover, oscillators on the daily chart have just started gaining negative traction and suggest that the path of least resistance for spot prices remains to the downside. Hence, any intraday move-up might be seen as a selling opportunity and remain capped near the 20.3825-20.3830 region, or the 100-day SMA support breakpoint.
However, some follow-through buying beyond the weekly top, around the 20.4040 area, might prompt some short-covering move and lift the USD/MXN pair to the 20.5040 area en route to the next relevant hurdle near the 20.6060-20.6070 region. The momentum could extend further towards the 20.7035-20.7040 resistance before spot prices eventually aim to challenge the monthly swing high, around the 21.0000 round-figure mark.
On the flip side, weakness below the 20.2540-20.2535 area could find some support near the 20.1810 region, or the monthly low touched on Monday. This is followed by the year-to-date through, around the 20.1345 zone, below which the USD/MXN pair could accelerate the fall towards the 20.0715 intermediate support en route to the December 2024 swing low, around the 20.0215 region.
USD/MXN daily chart