GBP/USD recovers after diving to 1.2500 on Trump’s remarks

- GBP/USD rebounds from 1.2506 low, trading at 1.2573 amid Trump’s tariff proposals.
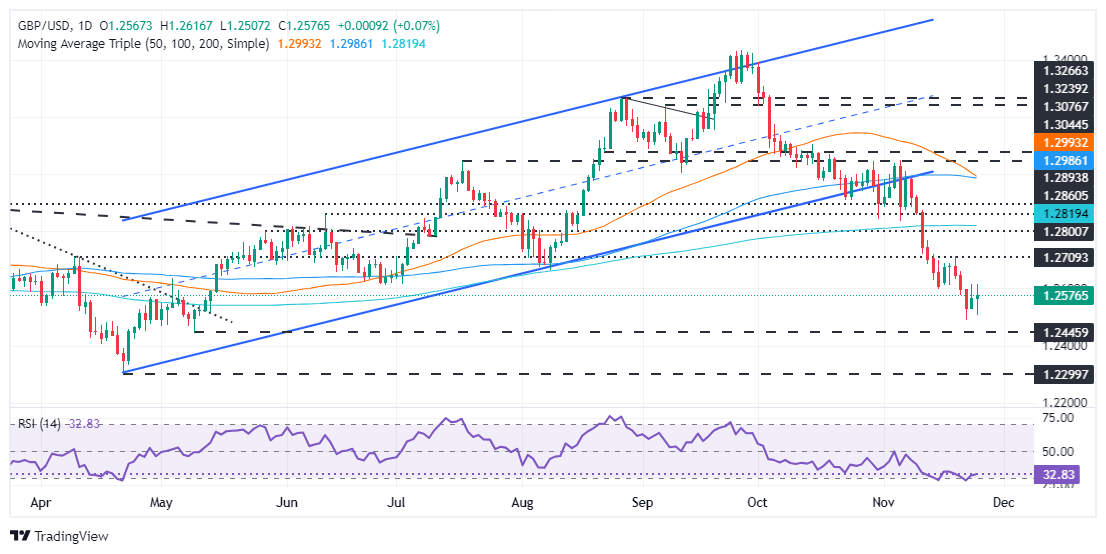
- Technical outlook mixed; support at 1.2550, bearish targets at 1.2506, 1.2486, and 1.2299.
- Bullish case needs break above 1.2600, targeting 1.2714 resistance and 200-day SMA at 1.2818.
The Pound Sterling recovered some ground following remarks of US President-Elect Donald Trump late on Monday afternoon, in which he said that once he takes office on January 20, he would impose 25% tariffs on Canada and Mexico and 10% on all Chinese products. This boosted the Greenback against most G8 FX currencies, the Mexican Peso and the Chinese Yuan. As of late, the GBP/USD turned positive in the day after hitting a low of 1.2506, trading at 1.2573.
GBP/USD Price Forecast: Technical outlook
The pair fluctuates at around 1.2570, and we are unable to gather a definitive direction, though it printed a higher high and a lower low as well. GBP/USD traders remain undecided, yet the new UK budget dented the odds for a rate cut by the Bank of England (BoE), dealing with an expansionary fiscal policy, putting upward pressure on inflation.
If GBP/USD drops below 1.2550, the first support would be the current week’s low of 1.2506. Once surpassed, sellers will eye the November 233 low of 1.2486, ahead of the year-to-date (YTD) low of 1.2299.
Conversely, if buyers move in, reclaiming 1.2600, the next resistance would be the November 20 peak at 1.2714. If cleared, a move to challenge the 200-day Simple Moving Average (SMA) at 1.2818 is on the cards.
GBP/USD Price Chart – Daily

British Pound PRICE Today
The table below shows the percentage change of British Pound (GBP) against listed major currencies today. British Pound was the strongest against the Canadian Dollar.
| USD | EUR | GBP | JPY | CAD | AUD | NZD | CHF | |
|---|---|---|---|---|---|---|---|---|
| USD | -0.07% | -0.07% | -0.35% | 0.93% | 0.49% | 0.23% | 0.10% | |
| EUR | 0.07% | 0.00% | -0.29% | 1.01% | 0.57% | 0.31% | 0.17% | |
| GBP | 0.07% | -0.01% | -0.25% | 0.99% | 0.56% | 0.30% | 0.16% | |
| JPY | 0.35% | 0.29% | 0.25% | 1.26% | 0.83% | 0.55% | 0.43% | |
| CAD | -0.93% | -1.01% | -0.99% | -1.26% | -0.43% | -0.69% | -0.83% | |
| AUD | -0.49% | -0.57% | -0.56% | -0.83% | 0.43% | -0.26% | -0.39% | |
| NZD | -0.23% | -0.31% | -0.30% | -0.55% | 0.69% | 0.26% | -0.13% | |
| CHF | -0.10% | -0.17% | -0.16% | -0.43% | 0.83% | 0.39% | 0.13% |
The heat map shows percentage changes of major currencies against each other. The base currency is picked from the left column, while the quote currency is picked from the top row. For example, if you pick the British Pound from the left column and move along the horizontal line to the US Dollar, the percentage change displayed in the box will represent GBP (base)/USD (quote).


