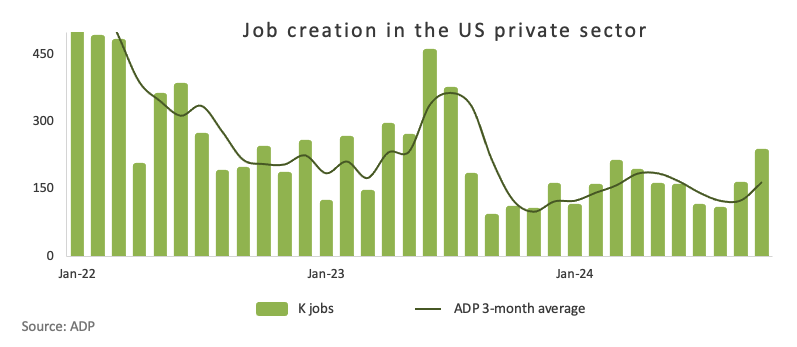
ADP report set to show decelerating job growth in November ahead of Friday’s NFP

- The ADP Employment Change report is seen showing a deceleration of job creation in the US private sector in November.
- The ADP report could anticipate the more relevant Nonfarm Payrolls report on Friday.
- The US Dollar looks to extend its positive start to the week.
The ADP Research Institute is set to publish its monthly update on private-sector job growth for November on Wednesday. Known as the ADP Employment Change report, it’s expected to show that US employers added 150K jobs last month, down from 233K in October.

Typically released two days before the official Nonfarm Payrolls (NFP) report, the ADP data is often viewed as an early preview of the Bureau of Labor Statistics (BLS) jobs report. However, the connection between the two has proven to be somewhat inconsistent over time. For example, while ADP showed a 233K gain in October, the official number reported by the BLS was a meager 12K.
Employment growth and its role in shaping Fed policy
US employment data has taken centre stage in determining monetary policy decisions since the Federal Reserve’s (Fed) Chief Jerome Powell and other rate setters suggested that inflation has been convincingly trending towards the central bank’s 2.0% target.
The Fed has been walking a tightrope in the post-pandemic economy, striving to balance its dual mandate: maximum employment and price stability. Faced with soaring inflation in 2022, the Fed responded by hiking interest rates to historic highs in a bid to cool the economy and bring prices under control.
The labour market played a crucial role in this equation. Tight job conditions risked adding more fuel to the inflation fire, but recent months have seen signs of a healthier economic balance. This shift allowed the Fed to adjust its strategy. At its September meeting, it surprised markets with a 50 basis-point (bps) rate cut and hinted that more reductions could be on the horizon.
True to this guidance, the Fed implemented an additional 25 bps rate cut at its November 7 meeting. Following this move, Chair Powell emphasised that the Fed is in no rush to continue cutting rates, signalling a potential pause in December. This hawkish shift led to a significant reduction in market expectations for further cuts at the December 18 gathering.
Fed officials, including Powell, have repeatedly described the US economy as being “in a good place.”
The CME Group’s FedWatch Tool currently shows a more than 75% chance of a quarter-point rate cut later this month.
However, upcoming employment data could influence these odds. A stronger-than-expected ADP Employment Change report might support the case for holding rates steady, bolstering the US Dollar (USD) by maintaining the Fed’s restrictive stance. Conversely, a weaker report could revive speculation about another rate cut, potentially challenging the Greenback’s recent strength.
Even so, any reaction to the ADP report may be fleeting. Investors are likely to wait for Friday’s Nonfarm Payrolls (NFP) report, which traditionally provides a more comprehensive view of the labour market, before making significant moves.
When will the ADP Report be released, and how could it affect the USD Index?
The ADP Employment Change report for November will be released on Wednesday at 13:15 GMT. It’s expected to show that the US private sector added 150K new jobs during the month.
As markets await the report, the US Dollar Index (DXY) is looking to consolidate a very auspicious start to the week, bouncing off last week’s lows near 105.60 and briefly reclaiming the 106.70 region so far.
From a technical perspective, Pablo Piovano, Senior Analyst at FXStreet, says: “The US Dollar Index (DXY) continues its steady climb, with the next major target being the recent cycle high just above the 108.00 level on November 22. Beyond that, it aims for the November 2022 top of 113.14 (November 3)”.
“On the downside, any pullback would first encounter support at the weekly low of 105.61 (November 29), seconded by the critical 200-day SMA, currently at 104.04, and the November low of 103.37 (November 5). Further declines could test the 55-day and 100-day SMAs at 103.95 and 103.29, respectively. A deeper retreat might even bring the index closer to its 2024 bottom of 100.15, recorded on September 27”, Pablo adds.
Finally, Pablo concludes: “The Relative Strength Index (RSI) on the weekly chart hovers around the 58 region and points upwards. At the same time, the Average Directional Index (ADX) has lost some momentum, receding below 44 but still indicative of a solid uptrend”.


