Bitcoin Weekly Forecast: A healthy correction

- Bitcoin experienced a 7% pullback earlier this week before recovering slightly and hovering around $97,000 on Friday.
- On-chain data shows a modest recovery in institutional demand, and holders bought back the recent dip.
- CryptoQuant report highlights that BTC has not reached overvalued levels and projects a rally continuation, reaching $146K.
- Other signs of optimism are Morocco legalizing cryptocurrencies and MicroStrategy and Marathon Digitat adding more BTC to their holdings.
Bitcoin (BTC) experienced a 7% correction earlier in the week, dropping to $90,791 on Tuesday before recovering to $97,000 by Friday. On-chain data suggests a modest rebound in institutional demand, with holders buying the dip. A recent report indicates BTC remains undervalued, projecting a potential rally toward $146K. Additional optimism stems from Morocco’s legalization of cryptocurrencies and major players like MicroStrategy and Marathon Digital increasing their BTC holdings.
Bitcoin institutional demand and BTC holders show signs of recovery
Bitcoin failed to reach the $100K milestone last week and started this week with a decline. It experienced a 7% pullback to a low of $90,791 on Tuesday before recovering slightly to close above $95,500 on Wednesday and hovering around $97,000 at the time of writing on Friday.
This week, institutional demand offers a clear perspective on Bitcoin’s pullback and recovery. According to Coinglass Bitcoin Spot Exchange Traded Funds (ETF) data, the week started with two consecutive days of outflows, totaling $558.1 million by Tuesday, followed by a modest recovery in demand through Thursday. If this inflow trend continues or accelerates, it could bolster the ongoing Bitcoin price recovery.

Total Bitcoin Spot Net Inflow chart. Source: Coinglass
Holders bought back the recent dip this week, as seen in the graph below. CryptoQuant Exchange Netflow shows that after BTC corrected from Monday’s high of $98,871 to Tuesday’s low of $90,791, holders accumulated a total of 35,449.3 BTC until Thursday, shown by three red bars.
%20-%20All%20Exchanges%20(2)-638684781360909782.png)
Bitcoin Exchange Netflow chart. Source: CryptoQuant
Despite holders accumulating recent dips, Glassnode’s weekly report highlights the surge of over 42% in Bitcoin’s price in the last three weeks. This surge has driven long-term holders to realize an unprecedented $2.02 billion daily profit, setting a new all-time high. The resulting supply overhang may require a re-accumulation phase before sustained price increases occur.
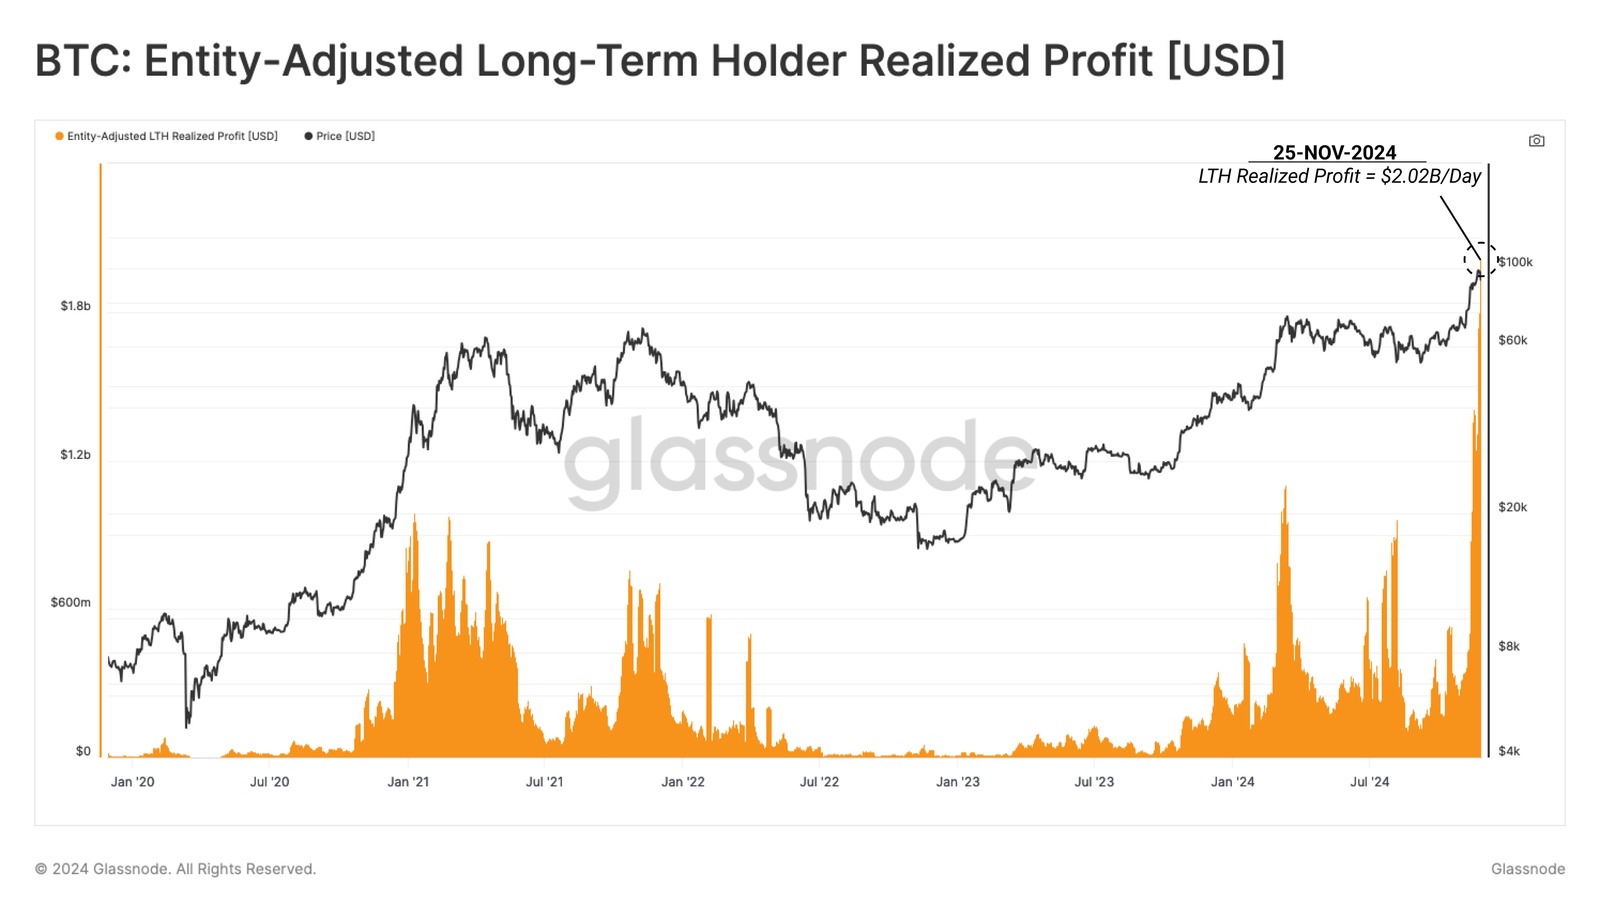
BTC Entity Adjusted LTH Realized Profit chart. Source: Glassnode
The report explains that most of this sell-side pressure originates from coins aged between 6 months and 1 year, accounting for 35.3% of the total. This suggests that more tenured investors remain measured and potentially wait patiently for higher prices. These selling volumes may describe swing trade-style investors who accumulated after the ETFs launched and planned to ride only the next market wave.
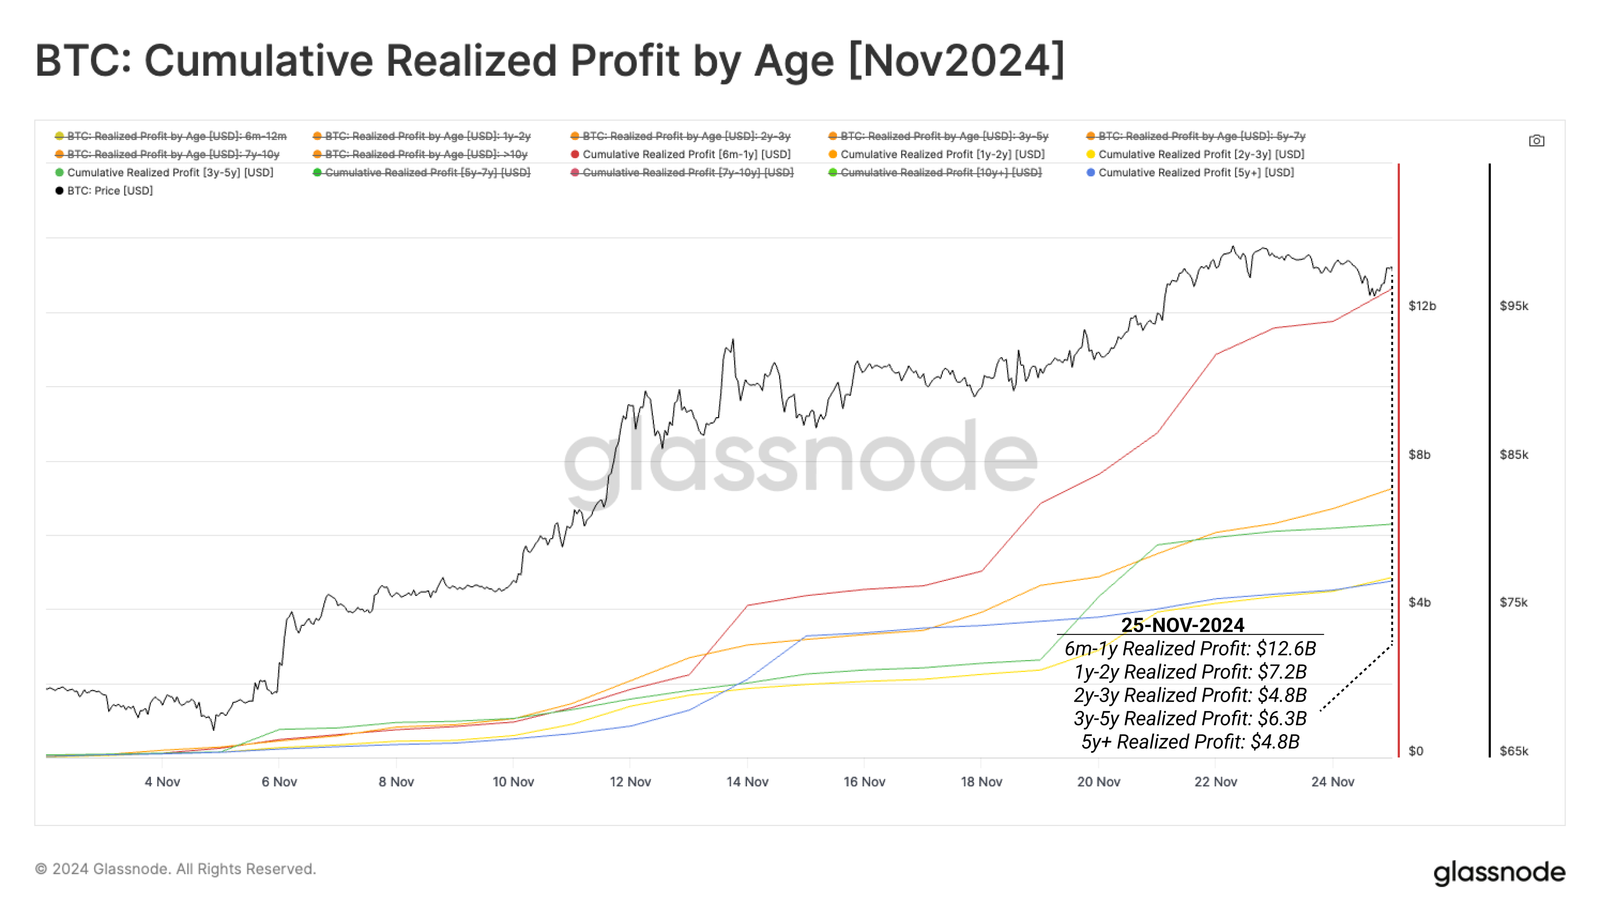
BTC: Cumulative Realized Profit by Age(Nov 2024) chart. Source: Glassnode
Report projects $146K mark for Bitcoin
CryptoQuant weekly report highlights that BTC has not reached overvalued levels and projects a rally continuation, reaching $146K.
Although the price has corrected toward $91,000 this week, the graph below shows that valuation metrics still indicate a bull market and that BTC has yet to reach the overvalued levels that typically precede the end of a bull cycle.
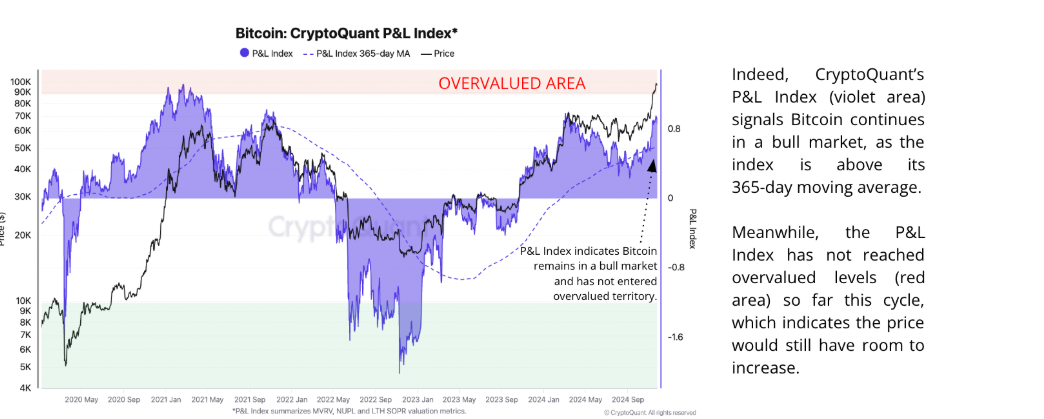
Bitcoin P&L Index chart. Source: CryptoQuant
The report further explained that Bitcoin’s top price target is currently $146,000 from a realized price valuation perspective (red line). This price band has acted as a top for Bitcoin’s price in previous cycles, such as April–May 2021.
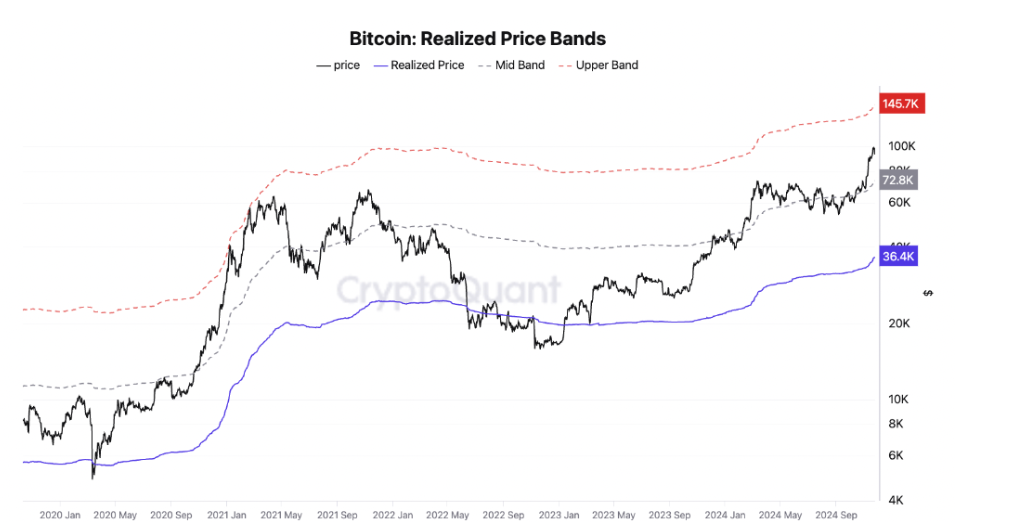
Bitcoin Realized Price Bands chart. Source: CryptoQuant
Other Signs of Optimism
Multiple optimistic news and events could support BTC’s rise towards the $100K milestone. MicroStrategy revealed on Monday that it made another heavy Bitcoin purchase, acquiring 55,500 BTC for $5.4 billion and holding a total of 386,700 BTC.
In an exclusive statement to FXStreet, Darren Franceschini, co-founder of Fideum, said that MicroStrategy’s approach offers investors a chance to partake in Bitcoin’s bullish trends. He further stated that the company is actively shaping the future of finance.
“By embracing Bitcoin at scale, the company is not just hedging against the future — it’s actively shaping it,” Franceschini stated.
On Tuesday, Morocco announced that it is moving towards legalizing all cryptocurrencies, reversing a ban on digital assets imposed in 2017. The country’s central bank, Bank Al-Maghrib, is reportedly preparing a new draft law for crypto regulation, which is currently under review.
With countries like Morocco, the UK, and others taking active steps towards crypto regulation, the landscape of digital finance is rapidly evolving. These changes indicate a shift towards a more structured and secure environment for cryptocurrencies, with more countries likely to follow suit as the global interest in digital finance grows.
Moreover, on Thursday, Marathon Digital (MARA) posted on its official Twitter account that itacquired an additional 703 BTC in November, increasing its total to 6,474 BTC, and still has $160 million available for future BTC dip purchases.
Marathon holds about 34,794 BTC, worth $3.3 billion, making it the second-largest corporate Bitcoin holder behind MicroStrategy. Marathon holds 0.16% of Bitcoin’s total supply, whereas MicroStrategy holds 1.8%.
BTC rally to $100K or correction to $90K?
Bitcoin price reached a new all-time high (ATH) of $99,588 last week and started declining. BTC corrected 7%, falling to a low of $90,791 on Tuesday. However, it recovered slightly on Wednesday. At the time of writing on Friday, it continues to recover and trades around $97,000.
If BTC continues to recover, it could rally to reach its ATH level of $99,588. The daily chart’s Relative Strength Index (RSI) indicator reads 67, above its neutral level of 50, indicating bullish momentum. However, traders should be cautious as the Moving Average Convergence Divergence (MACD) indicator showed a bearish crossover on Tuesday, signaling a sell signal.
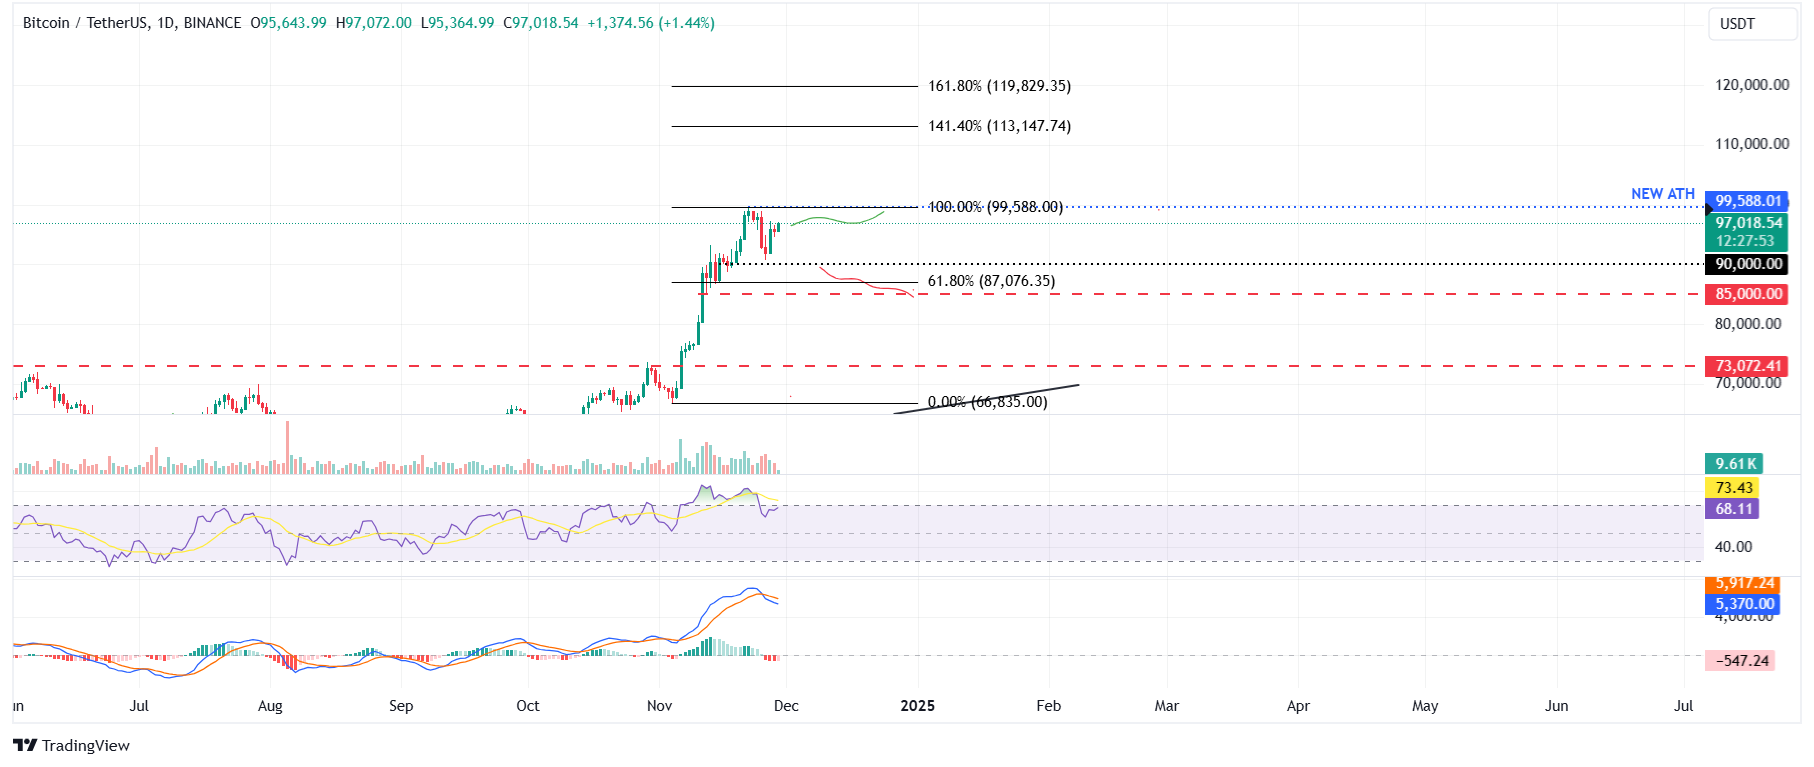
BTC/USDT daily chart
If BTC fails to recover and the pullback continues, it could extend the decline to retest its important psychological level of $90,000.


